Voyager 3 Project

Written by
Peter Rosén
Project Initiator, Voyager 3 Project and "A Journey to Jupiter"
July 8, 2014
In 1979, the Voyager 1 probe took a stunning series of images on its final approach to Jupiter that clearly showed the intricate movement of the cloud belts for the first time. Thirty-five years later, almost to the day, a group of seven Swedish amateur astronomers set out to replicate this odyssey and the historical NASA footage, but with images taken with their own ground-based telescopes.
The Voyager 3 project: Swedish amateur astronomers replicate Voyager 1's approach to Jupiter In 1979, the Voyager 1 probe took a stunning series of images on its final approach to Jupiter that clearly showed the intricate movement of the cloud belts for the first time. Thirty-five years later, almost to the day, a group of seven Swedish amateur astronomers set out to replicate this odyssey and the historical NASA footage, but with images taken with their own ground-based telescopes.Video: The Voyager 3 Project
My personal astronomical path got started in a way similar to many others'. As a teenager, I was invited to my school's astronomy club and was shown Saturn in a small telescope. I was absolutely mesmerized at that view, and it ignited a life-long passion for astronomy and especially for the solar system. This was probably partly out of necessity, as I have always lived in big, light-polluted cities where many deep space objects are simply out of reach.
Since the early 1980s I have been a professional photographer and digital imaging artist. The most exciting aspect of combining astronomy and photography is that we are able to reveal what’s invisible to the eye, either by increasing the resolving power or by accumulating the exposure for long periods of time to bring out extremely faint objects. Then there is all the power of the post-processing available at our fingertips.
Some years ago, I discovered the Voyager 1 sequence showing the intricate motion of Jupiter’s cloud belts for 28 consecutive days during its final approach. There is the speeding equatorial System1, the rotating Great Red Spot (GRS) and a multitude of local vortices that are not easy to grasp in this short animation.
Jupiter's cloud motions as Voyager 1 approaches This movie is based on 58 orange-green-blue color composites obtained on every Jovian rotation from January 6 to January 29, 1979. Over this period Voyager 1's distance from Jupiter dropped from 58 to 36 million km, so the resolution and sharpness of the frames increases from start to finish. The 58 frames were tweened, increasing the number of frames by a factor of 8 (that is, 7 synthetic frames are inserted between each real frame).Video: NASA / JPL-Caltech / Processed by Björn Jónsson
And what if...
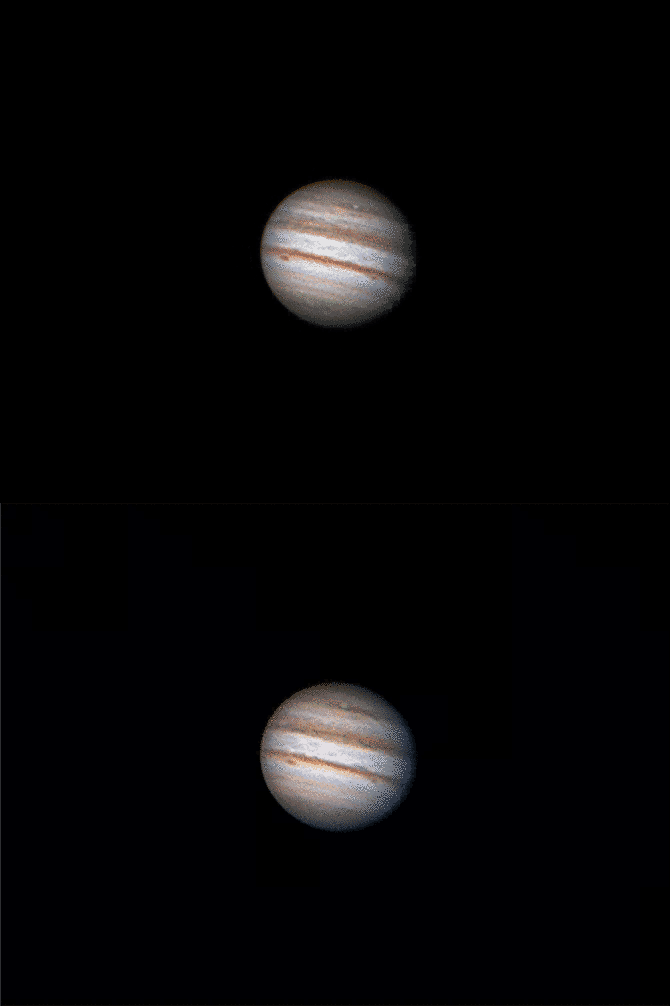
A test in early 2012 of blinking two images taken 24 days apart, revealed some features that seemed to have remained more or less in the same spot:
I shared the image on a local astronomy forum. That led to some discussions with Martin Högberg, who vividly shared my interest for this subject.
In December of 2013 I finally decided to launch a big team project and soon seven determined astrophotographers joined in. This was a major feat in itself, as it is usually quite a solitary hobby for most of us amateurs, one that we perform when the rest of our families have gone to sleep at night. Most of us had never met in real life, but we felt like we knew each other from having given feedback on each others' forum posts for a long time.
We would monitor the surface of Jupiter as continuously as possible for a period of 3 to 4 months, with the aim of achieving an animated cylindrical map of the planet that would reveal the intricate movements of its cloud belts. If we were able to achieve this goal, we would possibly also be able to reenact the Voyager 1 flyby at a later stage.
Determination was a key element to the project. Being at a high latitude, and often subject to bad weather and low temperatures in winter, Sweden is not really the ideal place to carry out such a project from. We hoped that our geographical spread over the southern part of the country would help us overcome some of the problems with the bad weather. It did indeed help, but at times we had clouds that covered the sky for all of us for weeks in a row.
We performed many initial tests at the beginning of December 2013, using the powerful and precise free software ”Winjupos”, gaining knowledge and continuously adapting the guidelines for the project. This included everything from file-naming to finding the best working procedures.
Everyone was to take pictures of Jupiter as often as possible. Much of our communication was about local weather conditions and the best time to shoot to be able to fill the gaps in the map, like pieces in a jigsaw puzzle.
During the day we adapted to the ordinary 24 hours clock but when the night came, we switched over to a 10-hour Jovian clock (9h 55m 41s, to be more precise). All our planning was completely synchronized to Jupiter's rotation period. The highest priority was not to get the best possible images but to cover the whole surface of Jupiter in the shortest possible time.
Everyone was to stack their own images the way they were used to, but leave a little headroom for adjustments and sharpening at a later stage. All the pictures were sent to me for a first round of post-processing to give them a homogeneous look. Then I sent them to Martin Högberg, who performed all the Winjupos trickery. He sent back to me three projections for every picture: one ”Cylindrical” and one ”Stereographic Polar” for each polar view.
We managed to complete our first map on the 28th of December 2013 which left us excited during the New Year period. We were on track and everything seemed to work just as planned.
But then the weather deteriorated and was the most overcast in the Stockholm area for January and February since 1988, and the rest of the country was not much better off. So it took us another two weeks to finish our second complete map.
The main problem is that the equatorial zone of Jupiter is rotating 7.63° more rapidly per day than the features to the north and south. (This leads to two distinct rotation periods that astronomers track on Jupiter: System1, the equatorial one, rotates once in 9h 50m 30s, while features to the north and south have a slower rotation rate, System2, rotating once in 9h 55m 41s). In two weeks' time, the difference in positions for features in System1 and System2 amounts to 107 degrees. This was of course way too much.
We kept working on, hoping to find a solution later on to this major problem. At the end of March, although the weather conditions were quite good, the receding position of the planet along with the nights getting rapidly shorter up here in the north made us decide to end the first part of the project. By then we had managed to produce 18 complete maps, one for every 5 days on average, but in reality they were very unevenly spread in time.
It was exciting to animate these maps as we saw the features in System2 come to life for the first time. The Great Red Spot (GRS) slowly drifted to the right while pumping the system of white clouds in the South Equatorial Belt (SEB). The yellow Oval BA marched continuously on its way towards its rendezvous with GRS. A little bit higher up we could follow the fast-laned three white ovals whose mutual positions and shape have given them the nickname ”Mickey Mouse”.
But the Equatorial Zone (EZ) just showed a multitude of features jumping around erratically. Obviously we needed more maps, and they had to be evenly spaced in time, to get some order in this high-speed chaotic lane. Some precise drift tables and lot of testing with some morphing programs clearily showed that this was the way to go, but the movement of Jupiter's cloud belts proved to be too complicated to be manipulated this way, because there were too many adjacent features that moved in opposite directions. The programs could simply not handle these sort of transitions without leaving artificial scars on the surface. I finally decided to divide the surface into 4 smaller areas, each with less-conflicting movements and animate them individually, generating 90 steps for the 90-day period. All these frames were then assembled in Photoshop and resulted in a fluid animation. We were really thrilled to see System1 come to life for the first time and flowing on like a stream.
After some more testing with different projections, I was able to import our animation frames into StarryNightPro+ to perform our final 90-day approach and flyby of Jupiter that you can see in the movie. All in all, it took 6 months of hard work to process the images and produce all the animations and then another two weeks for Göran Strand and myself to edit the film.
Thus ended the first part of the project. The second part, which will be handled by Johan Warell this summer, consists of measurements, drift charts and analysis of some of Jupiter's bands and features.
This has been a unique and exciting adventure for all of us in the project. From the beginning we knew the goal but not necessarily the way to get there. It has been much more hard work than we anticipated but also immensely rewarding.
Welcome to the Voyager 3 Project.
Peter Rosén
for the Voyager 3 Team

Breakthrough research starts with YOU!
Your support will empower the next round of STEP grant winners. Make your gift today to fund tomorrow's promising science and technology projects.
Donate

 Explore Worlds
 Find Life
 Defend Earth


