
 Explore Worlds
 Find Life
 Defend Earth


Saturn's hexagon recreated in the laboratory
Written by
Emily Lakdawalla
May 4, 2010
A lot of readers have expressed interest in the origin of Saturn's north polar hexagon. The hexagon is a long-lived pattern in the clouds surrounding Saturn's north pole, which has been observed since the Voyagers passed by in 1980 and 1981. Unlike Jupiter, whose cloud bands are obvious in visible light, Saturn's cloud features are more subtle in visible wavelengths. The cloud features pop to life when viewed at longer, thermal wavelengths, as in this Cassini VIMS mosaic:

There's an even cooler VIMS view of the hexagon, an animation:
The hexagon was first observed in Voyager images of Saturn, and immediately excited curiosity among scientists. In the years following Voyager, an oft-cited explanation for the origin of the hexagon was that it was a standing wave in Saturn's atmosphere. In order for it to be persistent, something needs to be driving it; that something was postulated to be a large, solitary storm observed in Voyager images at a latitude just south of the hexagonal feature. There were problems with this explanation, though, the chief one being that Cassini sees no such solitary storm, yet the hexagon is still there.
In an article published in the April issue of Icarus, Ana Aguiar and her coauthors advance an alternative explanation, and test it in the laboratory. The explanation has to do with the speeds of winds in Saturn's atmosphere. It begins with the following plot, showing how Saturn's wind speeds change with latitude.
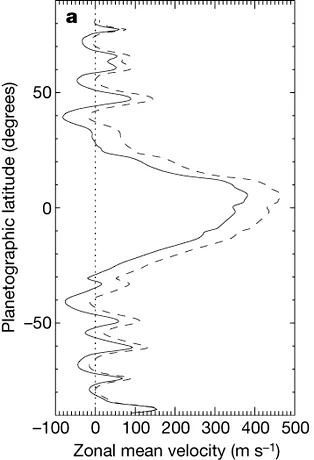
The hexagon corresponds to the latitude of the sharp, pointy, prograde peak at the very top of the above graph, about 78 degrees north. (There's another distinctively shaped band on Saturn, called the Ribbon Wave, that corresponds to the pointy peak at a latitude of about 48 degrees north). That pointy peak is actually one of the smaller ones on the plot, so you might not consider wind speed to be an important factor in driving a unique cloud feature.
Aguiar and her coauthors argue that it's not the wind speeds that are important per se; it's the gradient in wind speeds. Where there are steep contrasts in wind speeds -- adjacent parts of Saturn's atmosphere moving at very different speeds -- you can induce unstable behavior in a fluid, including waves, eddies, and swirls. That little prograde peak in wind speeds at around 78 degrees north is actually the narrowest peak on the graph, so that part of Saturn's atmosphere contains one of the steepest wind speed gradients to be found on the whole planet -- a good place to generate weird atmospheric features, including wavelike disturbances.
In the paper, Aguiar et al. run through a mathematical model that shows how the steep gradient in wind speed can set up a wavelike motion of this high-latitude jet, and that there are likely to be exactly six waves encircling the planet, setting up the hexagon (something that I explain in more detail here), and that wave propagates at about exactly the same speed as the jet flows (meaning that the hexagon will appear nearly stationary with respect to Saturn's rotation). Moreover, they show that the observed wind conditions near the south pole are sufficiently different from those near the north pole that the south pole is not predicted to produce a similar wave, which is good, because there's no hexagon at Saturn's south pole.
Having shown that the idea of wind speed gradients driving the formation of the hexagonal wave, they moved to the laboratory. Fun ensued, and science too.
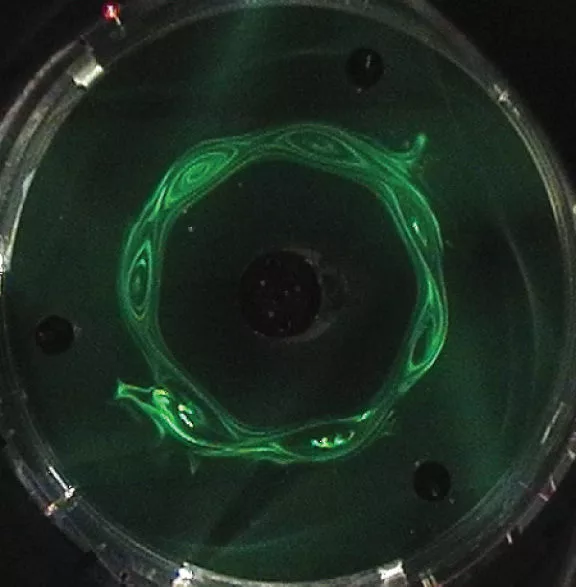
They set up a cylindrical, rotatable tank 10 centimeters deep and 60 centimeters wide. The tank had a lid and base that were split into concentric sections. They could rotate the inner circle of the lid and floor of the tank at a different rate than they rotated the outer circle of the tank and floor, setting up a gradient in the flow speed of the liquid at the joint between the inner and outer circles. Depending on the relative speeds of the two disks, different things happened. At low relative speeds, there was nothing particularly unusual in the flow, just rotation of the water in the tank. But as the gradient between the two rotating sections was increased, wavelike instabilities started forming at the boundary between the two disks. Depending on conditions, the waves evolved chaotically or sometimes quite stably; there might be as few as two or as many as eight waves encircling the axis of rotation. But for a reasonably wide range of experimental parameters, they produced a wavenumber of 6: a hexagon.

Think that image is cool? I've got something even cooler: video. They documented the flow patterns in two ways. To get pretty photos that are analagous to spacecraft photos of Saturn, they injected fluorescent dye into the water in the tank:
To track the precise speed at different points within the fluid, they changed the fluid to a mixture of water and glycerol and seeded it with pellets of Pliolite (the glycerol was used so that the tracer particles would have neutral buoyancy within the fluid):
I should note here something that Aguiar wanted me to mention, which is that her work is not at all the first time that such patterns have been created in the laboratory; here, for instance, is another example. She and her coauthors were just first to publish a paper making a case for so explicit a connection between such laboratory experiments and conditions on Saturn.
They did manage to make a hexagon like the one that's seen on Saturn, but with slightly different choices of initial conditions (spin rates) they generated waves with other wavenumbers too, meaning they got polygons of different shapes. I want to thank Ana Aguiar very much for taking the time to dig these other cases out of her files for me, and especially for being willing to share data that doesn't look like the hexagon-near-Saturn's-pole situation she was trying to reproduce with her experiment. I asked to see them because we may see a hexagon near Saturn's pole, but different conditions around different planetary atmospheres could conceivably produce other shapes. And also because it's just so cool to see something as apparently chaotic and unpredictable as the turbulent flow of a liquid produce geometrical shapes like triangles, septagons, and ovals.
Want wavenumber = 7? Here's a septagon.
How about "Saturn's triangle?" It doesn't exist, but if it ever does, we can explain that.

How about wavenumber = 2? Here's an oval for you.

Just to mess with you, here's the south pole of a planet that does have a polar oval, courtesy of ESA's Venus Express. I'm not saying it's caused by the same phenomenon Aguiar and her coauthors were exploring in the lab; I'm just saying you can get all kinds of polygonal shapes showing up near the poles of planets with deep atmospheres.

Finally, and just for fun: a video of a transition between a wavenumber=4 case and a wavenumber=3 case from Aguiar's lab. Can you imagine how fun it was to have this as a doctoral thesis project? I am sure that the experiments had their moments of tedium and frustration. But just imagine setting up an experiment, an apparently chaotic setup with fluid rotating in a tank, and see these bits of order emerge from that chaos. So cool!
Many, many thanks to Ana Aguar for the numerous emails she exchanged with me as I wrote this post.
Protect Our Shared Future
You help us defend humanity and prevent asteroid impacts. Donate now to become a Planetary Defender!
Donate