Björn Jónsson • Aug 21, 2013
Producing global views of Vesta from archival data
Editor's note: Archival image data from the early part of Dawn's mission to Vesta has been available since November, but the combination of Vesta's unusual shape, its fast rotation, and a unique lack of easy-to-assemble multi-footprint mosaics has made it extremely difficult to produce high-resolution global views of Vesta from the archival data. The problem is that the images can't just be puzzle-pieced together; they have to be draped over a 3-D model of Vesta's shape, something that is beyond the capability of most amateurs. In an earlier guest blog post, Daniel Macháček produced the best Vesta image processing work that could be done without this step, and that's the last I've seen of amateur attempts to process this data set -- until now.
Recently, Patrick Zawanowski, who goes by "Sarunia" at unmannedspaceflight.com, helped to convert the mission's publicly released shape model into a format that was more accessible to other amateurs, and Björn Jónsson took up the task. As Björn explains below, even with that help, it wasn't easy.
Last week, the Dawn mission released a lot more data, covering the Low-Altitude Mapping Orbit phase (when they did their highest-resolution imaging). Stay tuned for more great Vesta work from the amateur community. --ESL
Processing the Dawn images took more time than I was expecting; this ended up as one of the more complex image processing projects I have done.
But at least I now have two nice mosaics from the data, each using four sets of images, and I'm working on a Survey mosaic. [Survey refers to a phase of the mission in which Dawn was in orbit around Vesta at an altitude of 2700 kilometers. Here is a guide to the different phases of the Dawn mission to Vesta.] There were some false starts due to confusion because of the various coordinate systems (there are at least five of them) and I also spent some time on software improvements to streamline everything (in particular to get rid of a lot of time-consuming and error-prone copy/paste operations when dealing with the viewing geometry).
Due to Vesta's very fast rotation it turns out that there is no simple or easy way to assemble global mosaics where the terminator area is accurate. [Vesta's fast rotation means that areas on the edge of the sunlit portion of Vesta rotate quickly into darkness, making noticeable changes in the length and positions of shadows in the time that separates one photograph from another.] So after some experimentation I used the shape model and viewing geometry information to create simple cylindrical maps from the images. I then then used the shape model to render the maps without applying shading (the maps were draped over the model). I then rendered them again, this time with shading. The next step was to take the terrain near the terminator in the shaded renders and paste it into the non-shaded image using a feathered selection in Photoshop. Of course the shaded image data was too dark so I brightened it until there was no visual difference along the selection edges. This resulted in a realistic-looking image, even though some discrepancies in the direction of shadows might be visible somewhere if you look closely.
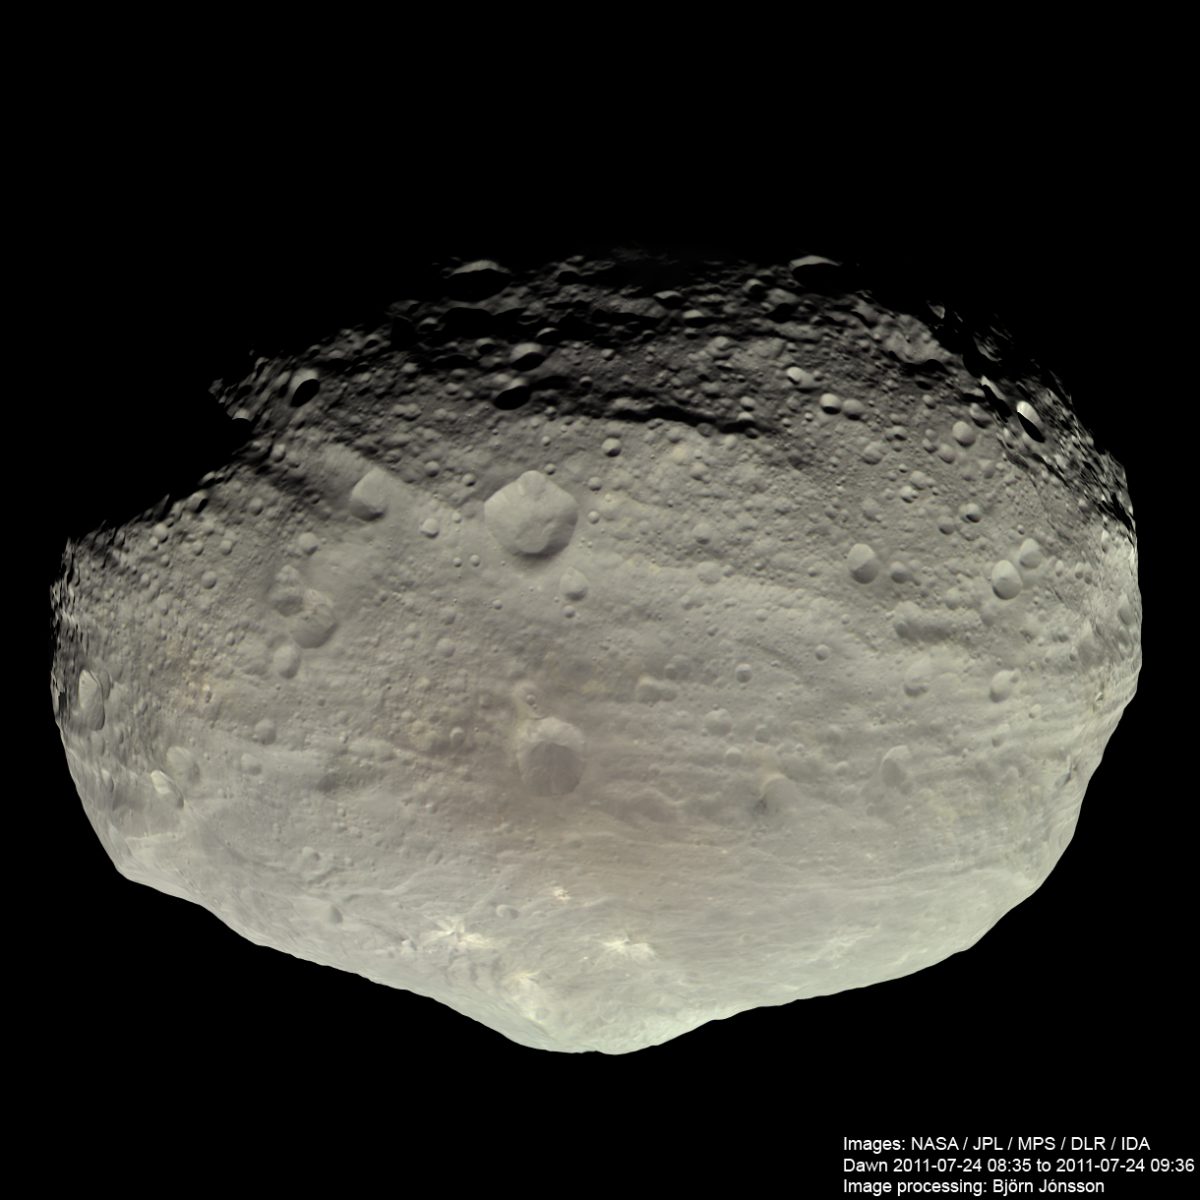
Here is an approximately true-color mosaic, made from the Rotation Characterization 3 data:

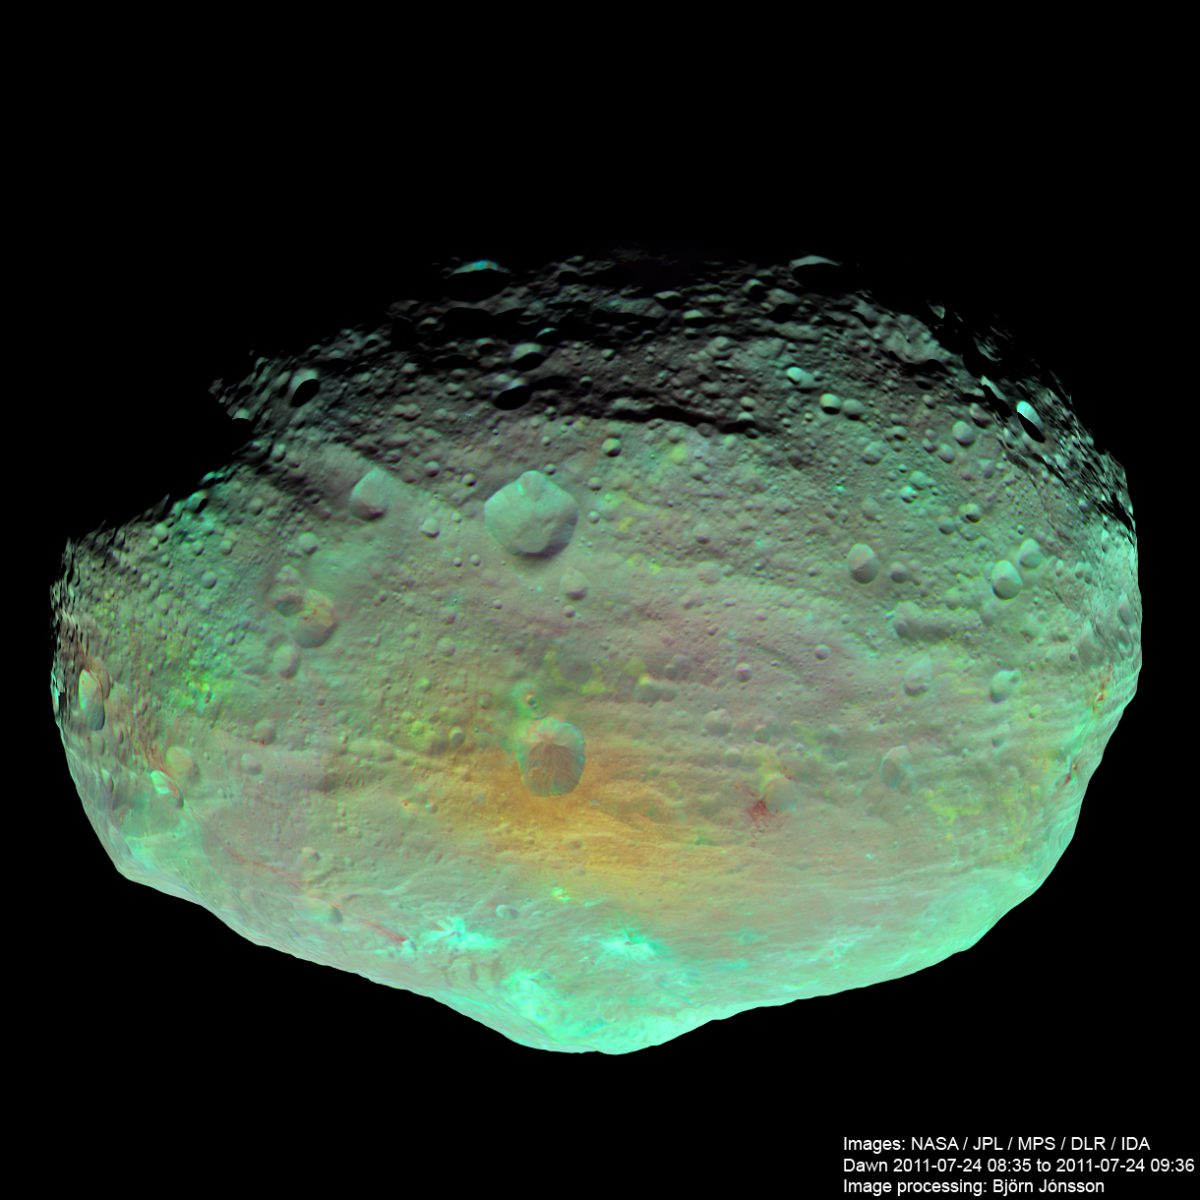
And here is a mosaic where data from the 918-nanometer, 749-nanometer, and 428-nanometer filters is used as red, green and blue, respectively. The color saturation has been increased to reveal color differences:

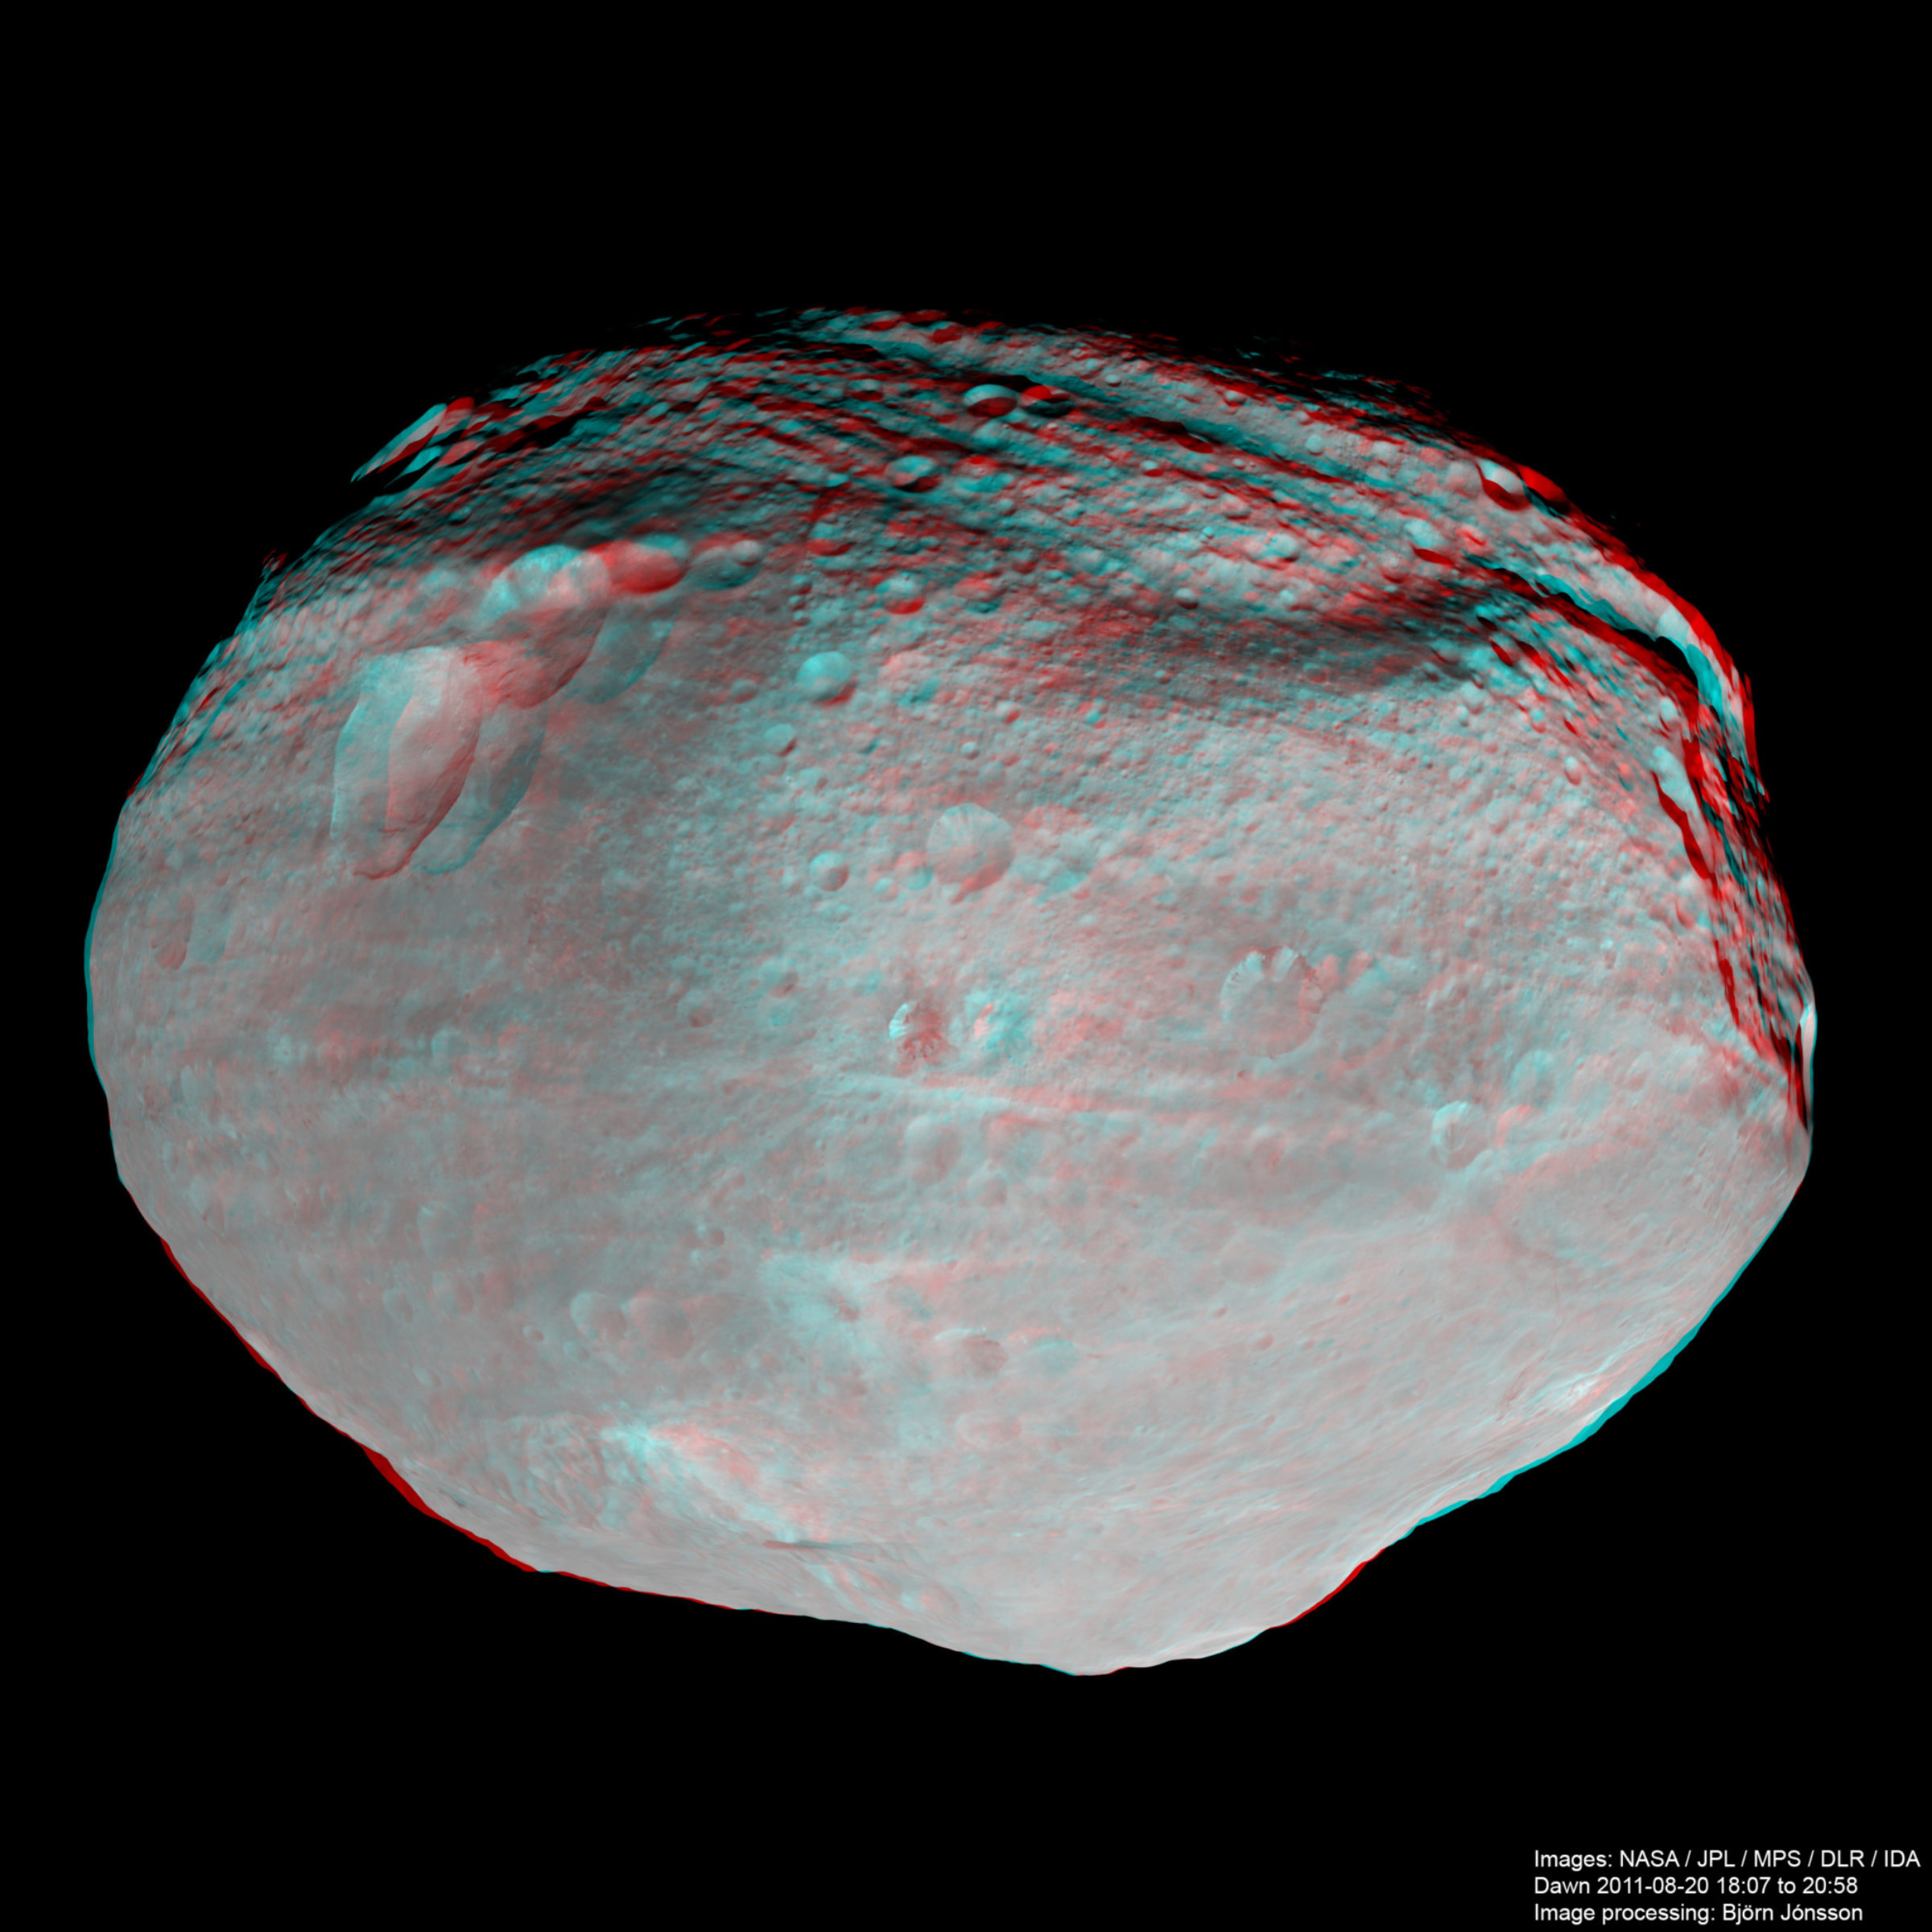
Finally, here is a global anaglyph from the survey data. This is a 'mosaic' of 18 blue filtered images and the processing to fix the terminator is identical to what I used for the RC3 images.

And now the LAMO data has been released - a strange coincidence that it happens just a few days after I started working on the earlier data!


 Explore Worlds
 Find Life
 Defend Earth

