
 Explore Worlds
 Find Life
 Defend Earth
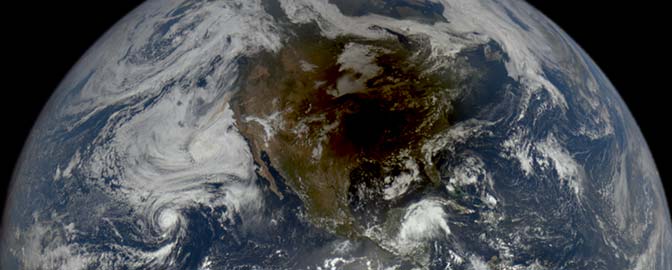


Emily Lakdawalla • Dec 20, 2017
#AGU17: Spherical harmonics, gravity, and the depth of winds at Jupiter
The Juno mission is all about understanding Jupiter’s interior. Last week at the American Geophysical Union Meeting in New Orleans, the mission announced that the Great Red Spot has roots 300 kilometers deep, based on data from the microwave radiometer. But Juno's microwave instrument can only peer a few hundred kilometers into a planet that’s 70,000 kilometers deep. To get deeper than that, Juno uses gravity and magnetic-field measurements.
At AGU, gravity scientists reported that Jupiter’s windy belts and zones penetrate much deeper than the Red Spot, to 3,000 kilometers. One way of interpreting this: Jupiter has an atmosphere that is 3,000 kilometers thick. Below that, Jupiter’s interior behaves more as a solid body -- it behaves like Earth does when it rotates. Its layers may be liquid in some places and solid in others, but even the liquid layers are all rotating together as a single entity. Several people shared aspects of this result, but Yohai Kaspi led the effort.
Trying to put the 3,000-kilometer depth in perspective, Kaspi said (my notes from his talk, so not verbatim): “If you're an atmospheric scientist...it contains 1% of the mass of Jupiter. It's huge. But from an internal model standpoint, it's just an atmosphere, it doesn't go down to depth, it’s not the concentric [differentially rotating] cylinders we were thinking about before.” In other words -- atmospheric scientists care a lot about it, but it's small enough for physicists to neglect. Everybody wins!
That, dear readers, is a major Juno result, a brand-new insight into the dynamics of the interior of Jupiter. It's tempting to end the post there, but I want to explain a little bit about how scientists figured it out from gravity data. It won't be easy because it involves a mathematical concept called spherical harmonics. “Spherical harmonics” sound esoteric but they're part of the basic vocabulary of the scientists who discuss gravitational and magnetic fields generated by solar system worlds, which means it’s going to come up on Juno again and again. So I'm going to give a shot to explaining the concept.
First, though, I need to explain Jupiter's winds. The reason for this digression will become clear later.
Jupiter's zonal winds
Jupiter's stripes result in part from strong winds blowing to the east or the west across the planet, along lines of latitude. Those winds are remarkably consistent with time. Here is a comparison of three measurements of wind speeds on Jupiter based on Voyager (red line), Cassini (blue), and Hubble (black) data:

You can see that in general, the strongest winds on Jupiter blow toward the east (that is, they are super-rotating). Two jets, one at about 20 degrees north and one at about 10 south, move clouds to the east at 150 meters per second -- that's 540 kilometers per hour!
It's easy to imagine that each dark-colored belt or bright-colored zone moves as a whole, like a conveyor belt. But most of Jupiter doesn't actually work that way. Most of the fastest jets move along the boundaries between belts and zones. See what happens when you overlay a wind diagram on a photo of the planet:

And because it exists and is awesome, I'll also share this animation of the motion on these clouds. Look back and forth between the animation and the graph above to see how the graph of wind speeds translates into motion. Can you spot the fastest-moving eastward jet in the northern hemisphere? Can you spot the fast-moving westward jet that makes the Red Spot spin? Notice that the motions of the winds aren't symmetrical about the equator. Remember that asymmetry; it's important.
A question scientists have had about Jupiter for a long time is: How deep do those banded belts and zones go? Are we seeing something painted on very topmost layers of the planet? Or are they really deep? Is there a different circulation pattern at depth than the one we see at the surface? Or do the wind patterns we see from space continue within the planet and then die out at depth into a solidly rotating interior? That's where Juno's unique gravity measurements come in.
How We Measure Gravity
First, consider the simplest interaction of a spacecraft with a planet: a flyby. When a spacecraft gets close to a massive object like a planet, it accelerates. When the spacecraft speeds away, it decelerates. The amount of acceleration and deceleration is mostly related to the mass of the planet: a more massive planet has a bigger effect. So we can use spacecraft flybys to measure planetary masses.
To measure how the speed of the spacecraft changes as it passes by the planet, we usually use line-of-sight Doppler tracking. The spacecraft broadcasts a radio signal to Earth, a signal that has a very precisely known frequency. (Spacecraft that are expected to do good gravity science are equipped with ultrastable oscillators to generate super-precise radio signals.) The spacecraft's speed toward or away from Earth raises or lowers that frequency slightly. When the speed changes due to the planet's gravity, the frequency of the spacecraft's signal also shifts. By measuring and recording these minute shifts, along with the distance between the spacecraft and the planet (measured using the two-way travel time of a radio signal), we can measure the force that the planet exerts on the spacecraft, and so determine its total mass in just one spacecraft flyby.
Things get a little bit more interesting if you can send your spacecraft sufficiently close to a planet. If you're closer to the planet than a couple of planet diameters, you can watch how the acceleration of the spacecraft changes as it travels across the planet's lines of latitude. Then the motion of your spacecraft is sensitive to how the mass is distributed within the planet. (In more technical terms, you can learn about the body's moment of inertia.) You might be able to figure out, for instance, whether it's internally stratified, with denser stuff in the middle, or not. With some assumptions about composition, you can figure out at what depth those internal stratifications lie. Cassini did this several times with different moons of Saturn. If you'd like to know more, here are some really good lecture notes on the topic by Francis Nimmo.
When you really get to have fun with gravity is if you can put your spacecraft in orbit around the planet, an orbit that gets quite close. The closer your spacecraft is to the planet, the more sensitive its motion is to lumps and bumps in the gravity field caused by excess or missing mass. That's why Juno orbits so much closer to Jupiter than any previous mission, getting within 5,000 kilometers of the cloud tops.
Here's where I admit that until last week, I didn't know there was more to gravity at Jupiter than just measuring the sizes and densities of the concentric shells of its interior, from its core all the way out to its atmosphere. I'm a solid-planet geologist. Beyond the moment of inertia stuff -- how much denser a planet is in the middle -- I think of gravity anomalies in terms of permanent features of solid worlds. Things like holes in the ground (impact craters) or mountains or dense volcanic rocks intruding light continental rocks. On a gassy giant planet, how much excess or missing mass can there be? If you somehow managed to dig a hole in an atmosphere, wouldn't gas just flow to fill it?
This is why Jupiter's winds are important. Where winds are blowing east, their motion adds speed to the planet's already high rotational speed. It's like that bit of Jupiter is spinning faster than the rest of the planet. Spinning faster means that around the latitude of the east-blowing winds, centrifugal force wants to make the planet wider. And conversely, where winds are blowing west, it's like slowing the spin of that part of Jupiter, and that part of Jupiter wants to be closer to spherical. So the winds are going to have an effect on the gravity field.
I feel like it's been too much text without an image, so here, have a pretty picture of Jupiter.

Juno Measures Gravity
At AGU, the Juno team was discussing the results from the first 8 science orbits of Jupiter. Because Juno has to point its dish directly at Earth to send its radio signal, not every science orbit can be a gravity tracking orbit. The gravity orbits have been 1, 3, 6, and 8. Each of these has sampled a different longitude of Jupiter. To begin with, the Juno gravity science team make the simplifying assumption that the gravity field doesn't vary with longitude. It's not a bad assumption since the east-west winds tend to average things out, and once they have better longitude coverage they can check the validity of their assumption later.

Each gravity orbit improves the team's knowledge of the gravity field, and not just because there's more data. It's also the changing geometry of the orbit. When Juno entered orbit, its orbital plane was almost perpendicular to the line-of-sight direction to the Earth. That is exactly what you don't want for Doppler tracking, because none of the change in speed that Juno experiences over the course of an orbit affects its speed in the direction toward or away from Earth, which is all we can measure from Doppler tracking. Over time, the orbit has been evolving, swinging around Jupiter, so with each orbit the Doppler data is more sensitive to Jupiter's gravity. It's even beginning to get sensitive enough to detect changes in Jupiter's gravity field caused by tides raised by the moving moons, Bill Folkner told us!
The data from gravity tracking is pretty simple and doesn't take up very much data volume. It's just a table of information -- measurements of spacecraft speed and distance, with respect to Earth, with respect to time. It takes a lot of computing power, using a process that I'll fully admit I don't understand, to calculate the best-fit gravity field that could produce the observed accelerations on the spacecraft. You have to fold in all kinds of other effects -- gravitational pulls from other bodies, other accelerations on the spacecraft due to differential heating, contamination of the radio signal from the Io plasma torus, etc. -- but clever scientists and engineers have a handle on all of this.
How best to communicate the result and the uncertainty? Gravity scientists use spherical harmonic coefficients, a way to describe a complicated shape using a relatively short list of numbers. I'm going to do my best to explain that here, because it will come up again and again in science results from Juno. If you can't follow, don't sweat it; just skip to the header at the end, "What do the Juno results tell us?"
Describing Jupiter's gravity field with spherical harmonics
If you look at Jupiter and describe its shape, how would you describe it? Your first impression is: it's a ball of a certain size. Look a bit closer at it and you realize it's actually wider at the equator than at the poles. You can describe this using a mathematical function that has low value at the poles and high value at the equator. You start out with a generic function, and multiply it by a constant or coefficient to make its height match the size of the equatorial bulge. That's a pretty good approximation, but there is some leftover shape that isn't adequately described by the flattened ball. So you need another mathematical function to describe that leftover shape, one that's low in the northern hemisphere and high in the southern hemisphere, or vice versa. Add that in and there will still be leftover shape. Keep going, approximating the shape of Jupiter with increasingly wavy functions, until you get to the limit of the data -- stop approximating when the sizes of the coefficients are similar to your measurement error. The more coefficients you report, the more detailed your model.
The images below show the shapes described by each of the first 20 zonal spherical harmonics of Jupiter. (There are other spherical harmonic patterns, called sectoral and tesseral, which matter for terrestrial planets, but since we're going with the simplifying assumption that Jupiter is the same at all longitudes, we only need to talk about the zonal spherical harmonics.) The goal of the Juno gravity science experiment is to figure out a list of constants to multiply these shapes by so that when they're all added together, they approximate the measured shape of Jupiter's gravity field.

For reasons I won't go into here, the coefficients are referred to as Jn. The first one is J0 and is just the mass of Jupiter. The second one, J1, is zero for gravity because J1 only describes an offset of the center of mass from the origin, and the center of gravity is the center of mass, so there's no offset. Earlier this year, members of the Juno team published a list of some of the first few coefficients: the even-numbered ones from J2 to J8. The low-order even-numbered ones are easier to get at because they are larger in magnitude than other coefficients.

As you can see, almost all of the nonspherical gravity is in the first coefficient, J2 -- it describes the flattening of Jupiter due to its spin, and its magnitude is about 25 times larger than the next coefficient, J4. The magnitudes of the coefficients keep decreasing down to J8. We already knew J2 from previous missions and flybys. It's J4 to J6 that started telling us more interesting things about Jupiter's interior. The problem is, we can't separate the effects of those near-surface winds on the gravity field from anything that's happening deep inside Jupiter.
What Kaspi and others presented at AGU were Juno results of more coefficients -- they reported all of them up to J10, not only the even ones but also the odd ones. Odd coefficients are not symmetrical about the equator, and neither are the winds. That makes the odd-numbered coefficients uniquely valuable at separating out the contribution of the near-surface winds from the contribution of other things happening at invisible depths. I couldn't write fast enough to write down what the coefficients were, but they were small, approximately the magnitude of J8. J3, J5, and J9 are negative, while J7 is positive.
Kaspi worked through four different methods to use the derived values of the odd harmonics to figure out how deep the winds penetrate. It's not yet possible to pin down the number for sure -- he said the value could be anywhere between 1000 and 3000 kilometers -- but all four methods agree on 3000 kilometers as a possibility, so he currently favors that depth.
What do the Juno results tell us?
Determining the 3000-kilometer depth of the winds allows other gravity scientists to remove the contamination of the near-surface winds from the even harmonics of Jupiter's gravity field, yielding a purer signature of the deep interior. Kaspi said that there was no evidence of any wind structure at depth that's different from what we see at the surface.
According to a presentation by Burkhard Militzer, it's beginning to look like there may not be a rock-and-metal core at the center of Jupiter. There would have been an Earth-like or super-Earth-like ice-and-rock-and-metal body at the very beginning of Jupiter's formation, but once Jupiter assembled itself to something like its present size, the core may have dissolved and been mixed into the mantle if the stirring of Jupiter's interior was vigorous enough. Previous studies have shown that metal and rock can actually dissolve in liquid metallic hydrogen. We still don't know yet from Juno whether there is a core way down there or if it got eaten by the mantle, but as the results shared at AGU demonstrate, we're on the way to finding that out.
And what about the Red Spot? If it has an effect on the gravity field, it will show up in spherical harmonic components that are sectoral (varying with longitude) or tesseral (varying in both longitude and latitude) rather than zonal. And, as far as the Juno gravity results can be read to date, there's no detectable variation of gravity with longitude. Juno can only check whether the Red Spot has a different contribution to gravity by flying over it. They've only had one such overflight so far, and won't have another one in 2018. There could be three or four Red Spot overflights in 2019 and 2020, so stay tuned!
Thanks very much to James Tuttle Keene for providing the simulated Jupiters and helpful comments on a draft version of this post.
Let’s Go Beyond The Horizon
Every success in space exploration is the result of the community of space enthusiasts, like you, who believe it is important. You can help usher in the next great era of space exploration with your gift today.
Donate Today