Emily Lakdawalla • Oct 08, 2009
A couple of helpful visualizations of LCROSS impact
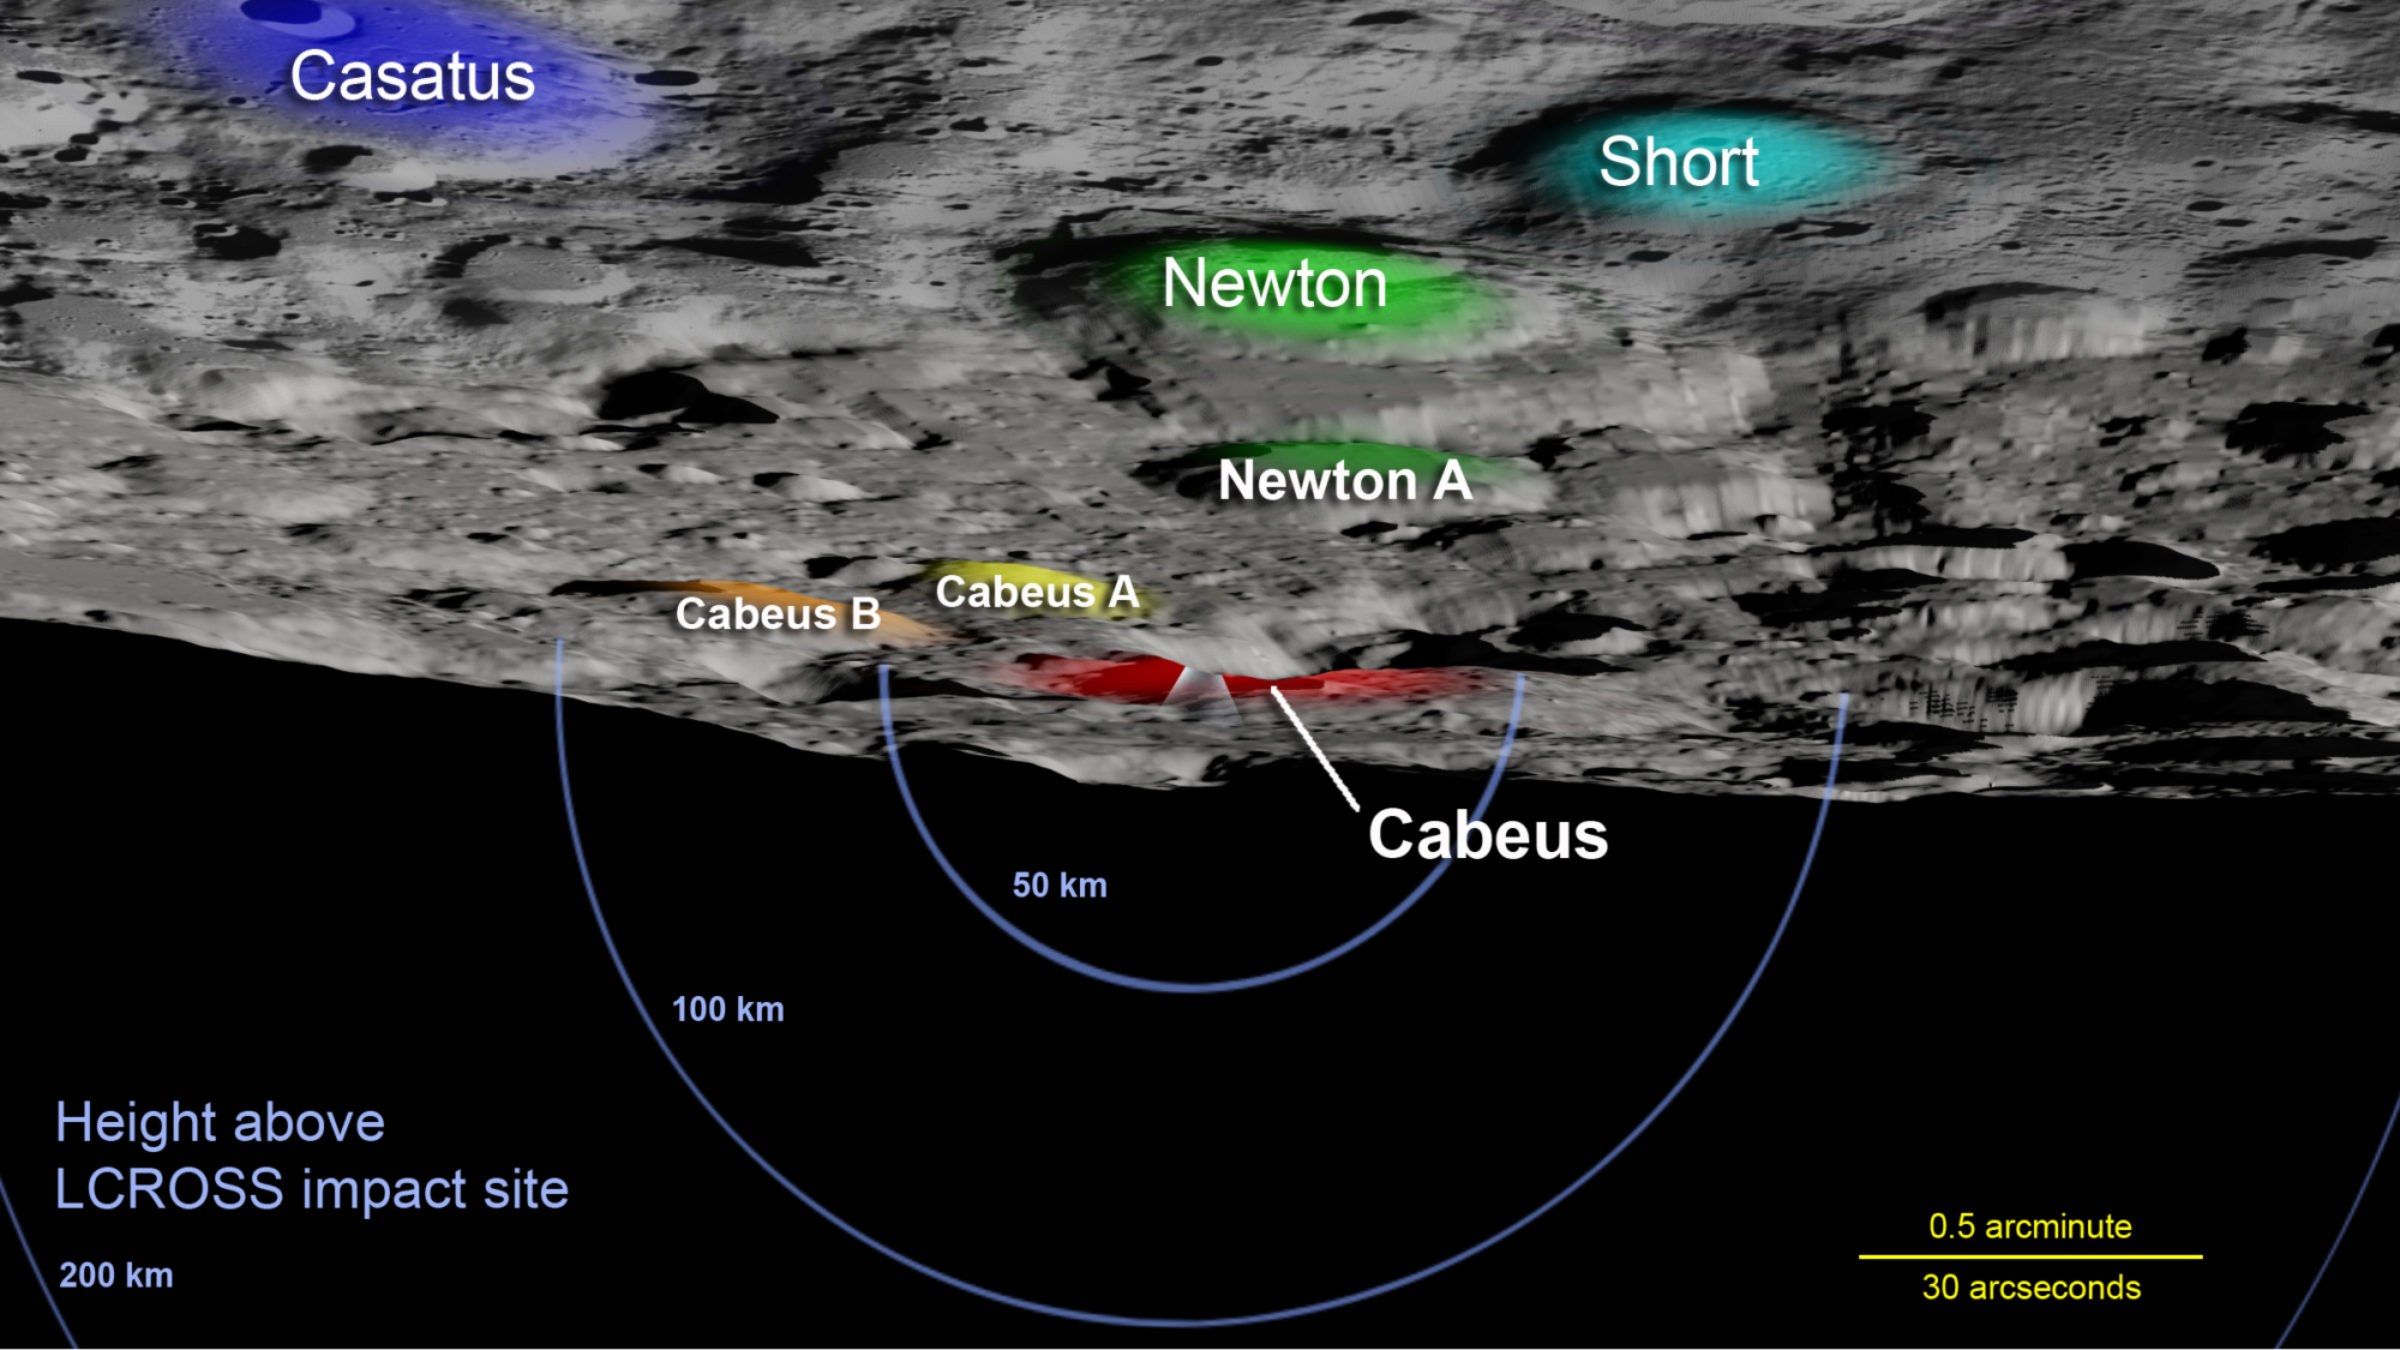
The visualization studio at Goddard Space Flight Center has just posted some handy simulations of what we can expect the LCROSS impact to look like. First, here's a movie that zooms in from the entire moon to the ejecta curtain in Cabeus; the blue arcs represent 50, 100, and 200 kilometers above the impact site.
And here's a map of that south polar region. The red shading indicates the location of the crater Cabeus; because it's there it's hard to tell that the ejecta curtain will be viewed against a black, shadowed backdrop, a plus for astronomers.

These visualizations aren't just eye candy. They were developed as a part of the impact site selection process, which sought to find a location that had the greatest likelihood of containing substantial subsurface water while satisfying various geologic requirements (in a smooth part of the floor, low temperature, permanently shadowed) and viewability requirements. The Visualization Studio used as input very recently acquired topographic data on the lunar south pole from Kaguya and Lunar Reconnaissance Orbiter and discovered a combination of topographic features that will provide for a well-lit plume visible within a couple of kilometers above the site of the impact against a black backdrop.
The Time is Now.
As a Planetary Defender, you’re part of our mission to decrease the risk of Earth being hit by an asteroid or comet.
Donate Today

 Explore Worlds
 Find Life
 Defend Earth

