
 Explore Worlds
 Find Life
 Defend Earth


DPS meeting: Saturday: Enceladus -- it's cooler than we thought
Written by
Emily Lakdawalla
October 14, 2008
I'll be writing quite a bit about the annual meeting of the Division of Planetary Sciences (DPS) of the American Astronomical Society this week; see this post for an introduction. I got distracted by the fires yesterday, but things are looking less threatening this afternoon, so I'm back to work.
John Spencer spoke on the results from the CIRS instrument of the March and August 2008 flybys of Enceladus. CIRS is an infrared sensor that can detect thermal emission from most surfaces in the Saturn system (though some of the surfaces are so cold that the thermal emission occurs at wavelengths longer than CIRS can "see.") How bright a surface appears at these thermal wavelengths correlates with its temperature; it takes some detailed modeling to figure out exactly how brightness correlates with temperature, especially for places like Enceladus where the field of view of CIRS may encompass materials with very different temperatures. In the past, CIRS has shown Enceladus' south pole to be anomalously hot, with some approximate correlation between the hottest areas and the locations of the "tiger stripes" (see here for some background).
John opened his talk with a very helpful summary of the eight close Enceladus flybys planned for the three years of 2008 to 2010. Since I can pause the playback of this session (thank you again to the IT magicians at Cornell) I can reproduce it fully here:
| Date | Orbit | Speed (km/s) | Alt. (km) | Orbit inc. | Close approach science emphasis |
|---|---|---|---|---|---|
| March 12, 2008 | 61 | 14.3 | 50 | High | Plume sampling |
| August 11, 2008 | 80 | 17.7 | 50 | High | South pole remote sensing |
| October 9, 2008 | 88 | 17.7 | 21 | High | Plume sampling |
| October 31, 2008 | 91 | 17.7 | 196 | High | South pole remote sensing |
| November 2, 2009 | 120 | 7.7 | 96 | Low | Plume sampling |
| 121 | 7.7 | 1,560 | Low | South pole remote sensing | |
| April 28, 2010 | 130 | 6.5 | 96 | Low | South pole gravity |
| May 18, 2010 | 131 | 7.0 | 246 | Low | Plume solar occultation |
The map has a resolution of around 5 to 10 kilometers per CIRS pixel, and the "warm" areas are beautifully localized along the four sulci (or "tiger stripes"). In this map, Alexandria and Cairo were cooler than Baghdad and Damascus; the hottest areas were near the middle of Damascus. John compared this image to the locations of plume jets mapped from camera images, and there is pretty good correlation between some of the plume sources (particularly the ones on Damascus) with the hot areas in CIRS, though John pointed out that "it's not like there are sharp peaks at the plume sources; there is continuous emission varying pretty smoothly along the tiger stripes." In August they got an intermediate-resolution map of the same area. He compared the temperature maps from March and August, and emission looked similar from three of the four stripes between the two times, with the exception being Baghdad. He said he wasn't convinced they were actually seeing temporal variation at Baghdad, however. Modeled temperatures are pretty consistently around 160 Kelvin, with the highest temperatures hitting no more than 167.
He was particularly happy with some wonderful targeting that had been done during the August flyby, in which the shortest-wavelength detector of CIRS was perfectly parked along Damascus Sulcus for two minutes, giving them an excellent-quality data set. Performing their temperature modeling, they came up with a temperature of 160.1 plus or minus 1.3 Kelvin. This is much lower than the temperature they modeled from their March data (190-200 Kelvin), and while it could represent a real change in temperature, John thought it was more likely that the difference is due to the August data being of better quality. I will post a screen cap of that wonderful piece of targeting:
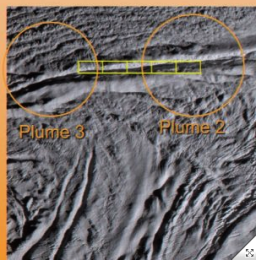 | Amazing targeting of CIRS instrument on Damascus Sulcus During the August 2008 flyby of Enceladus by Cassini, the shortest-wavelength detector of the CIRS infrared spectrometer was "parked" over one of the hottest spots on the south pole, one of the "tiger stripes" named Damascus Sulcus, for two minutes. The long "stare" permitted the CIRS team to acquire their best-quality data set yet on the thermal emission from this south polar fracture. The results showed Damascus to be cooler than previously estimated, at a temperature of 160 Kelvin. Although the low temperature could be a result of temporal change since March 2008 (when temperatures as high as 190 to 200 Kelvin were reported), the difference is more likely due to the difference in the quality of the data; the August data is the more reliable. Credit: from John Spencer's presentation to the 2008 DPS meeting |
Carly Howett gave a talk on "The Endogenic Power of Enceladus' South Pole as observed by Cassini/CIRS and Thermal Inertia and Bolometric Albedo of all Saturn's Icy Satellites," which is an awfully long talk title, but it boils down to a few notes. She showed CIRS data on the thermal inertias of Saturn's moons -- this is a property that basically measures how quickly a surface responds to changes in temperature -- and she found that Saturn's moons have thermal inertias "two to three times lower than the Jovian [Jupiter's moons] values, which is indicating that our surface is significantly less cohesive." Less cohesive means that Saturn's moons have a snowier, fluffier surface than Jupiter's moons. Also, she showed computations that suggest that there's 13.8 Gigawatts of power coming out of Enceladus' south pole, which is, I think, quite a bit more than earlier estimates put it.
Paul Helfenstein gave a detailed presentation on initial geologic mapping of the south polar terrain of Enceladus from the wonderful high-resolution "skeet shoot" images shot during the August flyby. A few interesting conclusions here: in addition to the four well-known active "tiger stripes," he also presented evidence for "morphologically degraded and/or thermally eroded" and "relict" or "extinct" tiger stripes -- indicating that where the plumes come out of Enceladus' south pole shifts over time, building up new stripes and destroying old ones. Now, there would have to be some kind of way to create new surface and destroy old surface, or else we'd see craters, but this was a more detailed explanation of how that happens. He also mentioned that several tiger stripes have, running down their medians, narrow ridges, which he referred to as "shark fins" -- "this is turning into a real zoo here."
He had a bunch of really cool examples of tectonic features that I can't -- just now -- find on Enceladus images. For instance, he went through an exercise that has long been popular with poeple who work on Europa tectonics: he found obvious faults in images, and tried cutting images along the faults and sliding the terrain along the fault until he could get various lineaments to match up across the fault. This puzzling worked, but not the same way it does on Europa. On Europa, solving the puzzle usually just means excising a slice of terrain, new land that formed as something spread apart; Earth's mid-ocean ridges operate in a similar way. On Enceladus, it seems that the spreading occurs in a distributed way, with new terrain being created not at one locus but all along a region of spreading. I don't feel like I'm making much sense here -- I'll have to hunt down the region that Paul showed in his talk and try to solve the puzzle myself. He also showed an example of an area that's been sheared; reconstructing the shear, he discovered a previously unknown, badly degraded circular feature, likely a crater, somewhere in that ropy southern terrain; the once-circular crater has now been dragged out into an ellipse.
Paul closed by showing a tiger stripe, one of whose ends had been sheared off by a fault (a right-lateral transform fault, for those of you who enjoy structural geology). After the faulting, the tiger stripe evidently re-grew its end -- "tiger stripes re-grow their amputated limbs," Paul announced.
Finally there were two modeling papers. Andy Ingersoll presented a paper in which he asserted that people who have been trying to model what, mechanically, is happening under the surface of Enceladus to generate the plumes and the heat, have failed to account for something having to do with the vapor pressure of gas in equilibrium with very cold ice, which he said would be very low and therefore a very poor conductor of heat; which would, in turn, result in melting near the surface. I didn't follow all his arguments; there were two pointed questions after his talk (I recognized Bill McKinnon's voice, but not the other) that indicated doubt from the room, but it's no surprise to hear such doubt following someone telling everyone else in the room they've been wrong with their models. I wasn't sure what to make of this paper. Terry Hurford presented on another possible source for tidal heating within Enceladus, physical libration, which differs from the already-considered optical libration in a way that I didn't understand. (The farther I get from graduate school, the harder it is for me to comprehend these geophysics-type papers. It's sad.)
As promised, here's a mosaic of some of the Enceladus photos that Cassini snapped last week, covering the southern hemisphere of the moon.
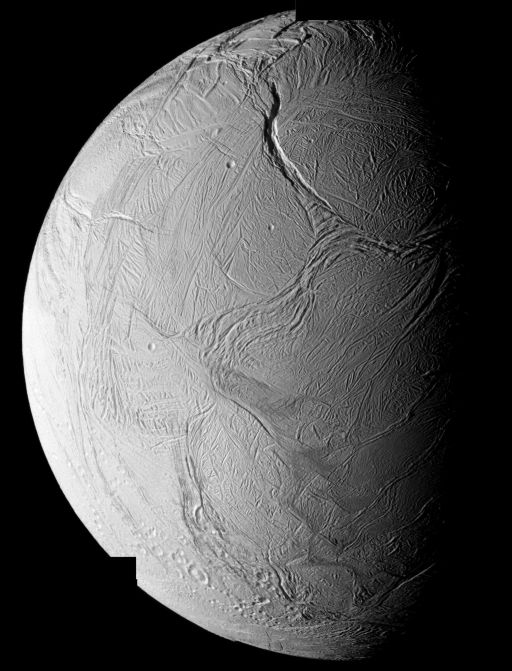 Mosaic of Enceladus' southern hemisphere from the October 9, 2008 Cassini flyby Shortly after its closest-ever approach to Enceladus on October 9, 2008, Cassini snapped a multispectral mosaic of the southern hemisphere. This is a mosaic of five images. The four sulci of the south polar terrain are at lower right: from the top, Damascus, Baghdad, Cairo, and Alexandria sulci. Above them, near the center of the disk, is the scalloped edge of the south polar terrain, a feature named Cashmere sulcus. North of Cashmere, Labtayt sulcus makes a deep gouge in Enceladus' crust, highlighted strongly because it is parallel to the terminator (day-night boundary). Labtayt terminates in the ropy ridges of Cufa (left) and Ebony (right) dorsae. Credit: NASA / JPL / SSI / mosaic by Emily Lakdawalla |
Protect Our Shared Future
You help us defend humanity and prevent asteroid impacts. Donate now to become a Planetary Defender!
Donate