 Explore Worlds
 Find Life
 Defend Earth
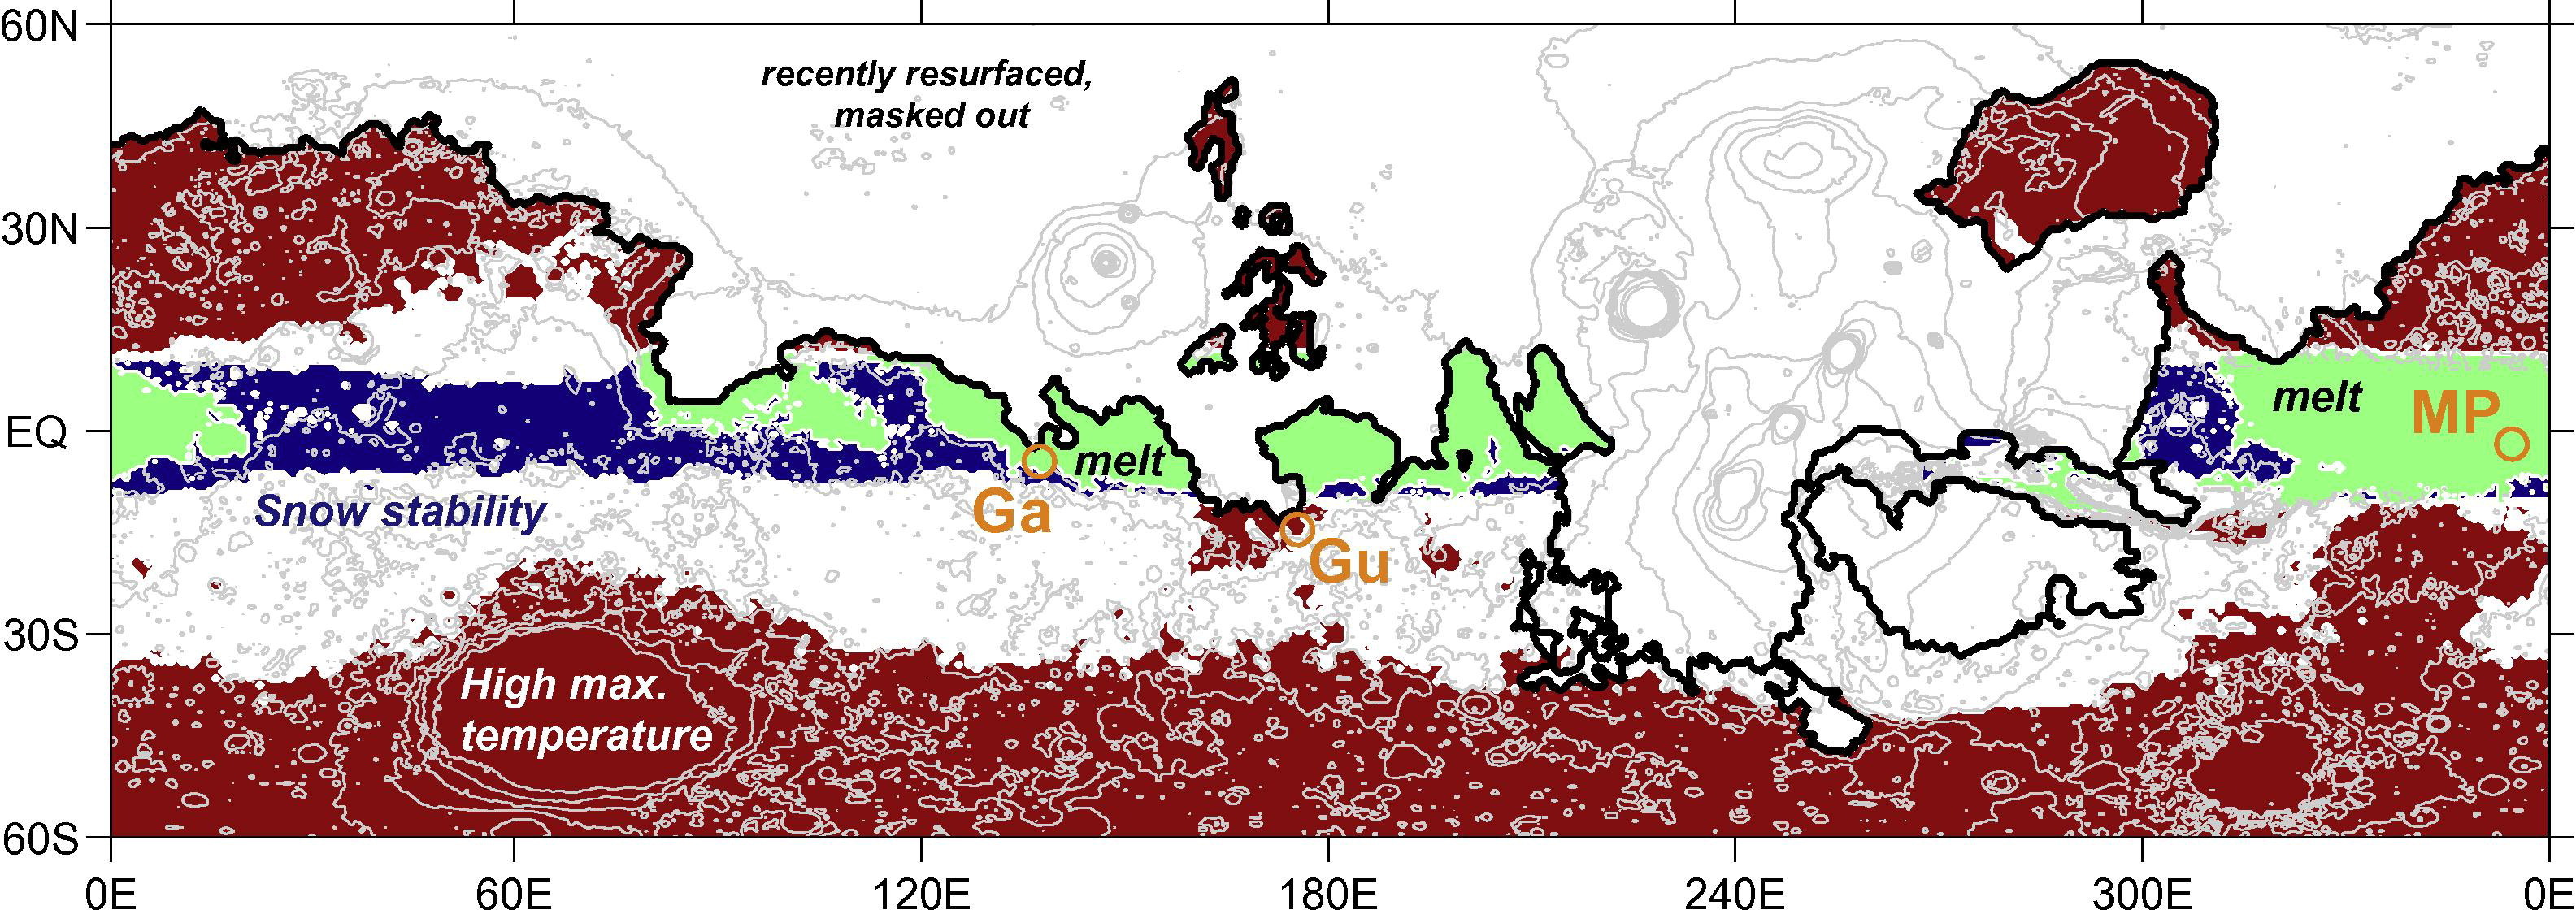
Snapshot of snowmelt distribution for a single example of orbital forcing, showing role of snow stability and melting potential.


Accelerate progress in our three core enterprises — Explore Worlds, Find Life, and Defend Earth. You can support the entire fund, or designate a core enterprise of your choice.
Give Today
Know the Cosmos and our place within it.
Empowering the world's citizens to advance space science and exploration.