
 Explore Worlds
 Find Life
 Defend Earth


Enceladus' south polar hot spot
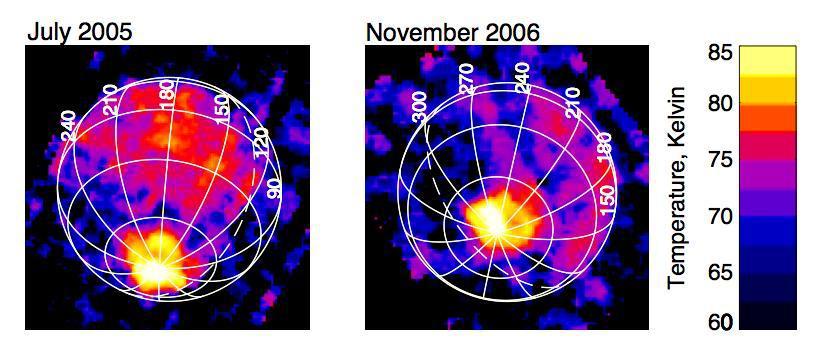
On November 9, 2006, Cassini's Composite Infrared Spectrometer (CIRS) captured its first view of Enceladus' south polar "hot" spot since its discovery 16 months earlier. The distribution of heat suggests that most of the heat comes from the "tiger stripes," more formally known as "sulci," that cross Enceladus' south pole, although the resolution of the CIRS observation is not high enough to resolve the tiger stripes.
The images show the intensity of heat radiation in the 10- to 16-micron wavelength range, translated into temperature and displayed in false color. Peak south polar temperature on both dates reached about 85 Kelvin (minus 306 degrees Fahrenheit), averaged over the 30-kilometer (19-mile) spatial resolution of the data. However, the variation in brightness with wavelength, which is also measured by the composite infrared spectrometer, reveals that the warm region includes small areas, possibly zones a few 100 meters (320 feet) wide along the length of the tiger stripes, that are at higher temperatures, reaching at least 130 Kelvin (minus 225 degrees Fahrenheit) and perhaps much warmer still. While the south polar tiger stripes are almost certainly heated by energy from the moon's interior, daytime regions at low latitudes are warmed by sunlight to temperatures in the high 70s Kelvin (about minus 320 degrees Fahrenheit).
The blotchy appearance of the cooler regions away from the south pole, and of the sky beyond the globe of Enceladus, is an artifact resulting from the fact that apart from the polar hot spot, the composite infrared spectrometer can barely detect the very faint heat radiation from this very cold moon.
NASA / JPL-Caltech / GSFC / SwRI