
 Explore Worlds
 Find Life
 Defend Earth


LPSC, Wednesday: More from the Moon -- SMART-1 and radar
Written by
Emily Lakdawalla
March 13, 2008
Here's an update on Wednesday's lunar sessions at the Lunar and Planetary Science Conference from image magician Ted Stryk. Many thanks to Ted for his detailed notes!
Also, I want to point to the Martian Chronicles where Ryan Anderson wrote yesterday about an alternative view on the layering seen by the rovers; on how carbon dioxide couldn't have made a past Mars warm; and on Mars' crustal dichotomy. And Briony Horgan checked in with her views on NASA Administrator Mike Griffin's speech on Monday evening. Finally, I want to mention that I messed up the URL for Jason Perry's Gish Bar Times yesterday, so I'm including another link and an apology! OK, over to you, Ted...
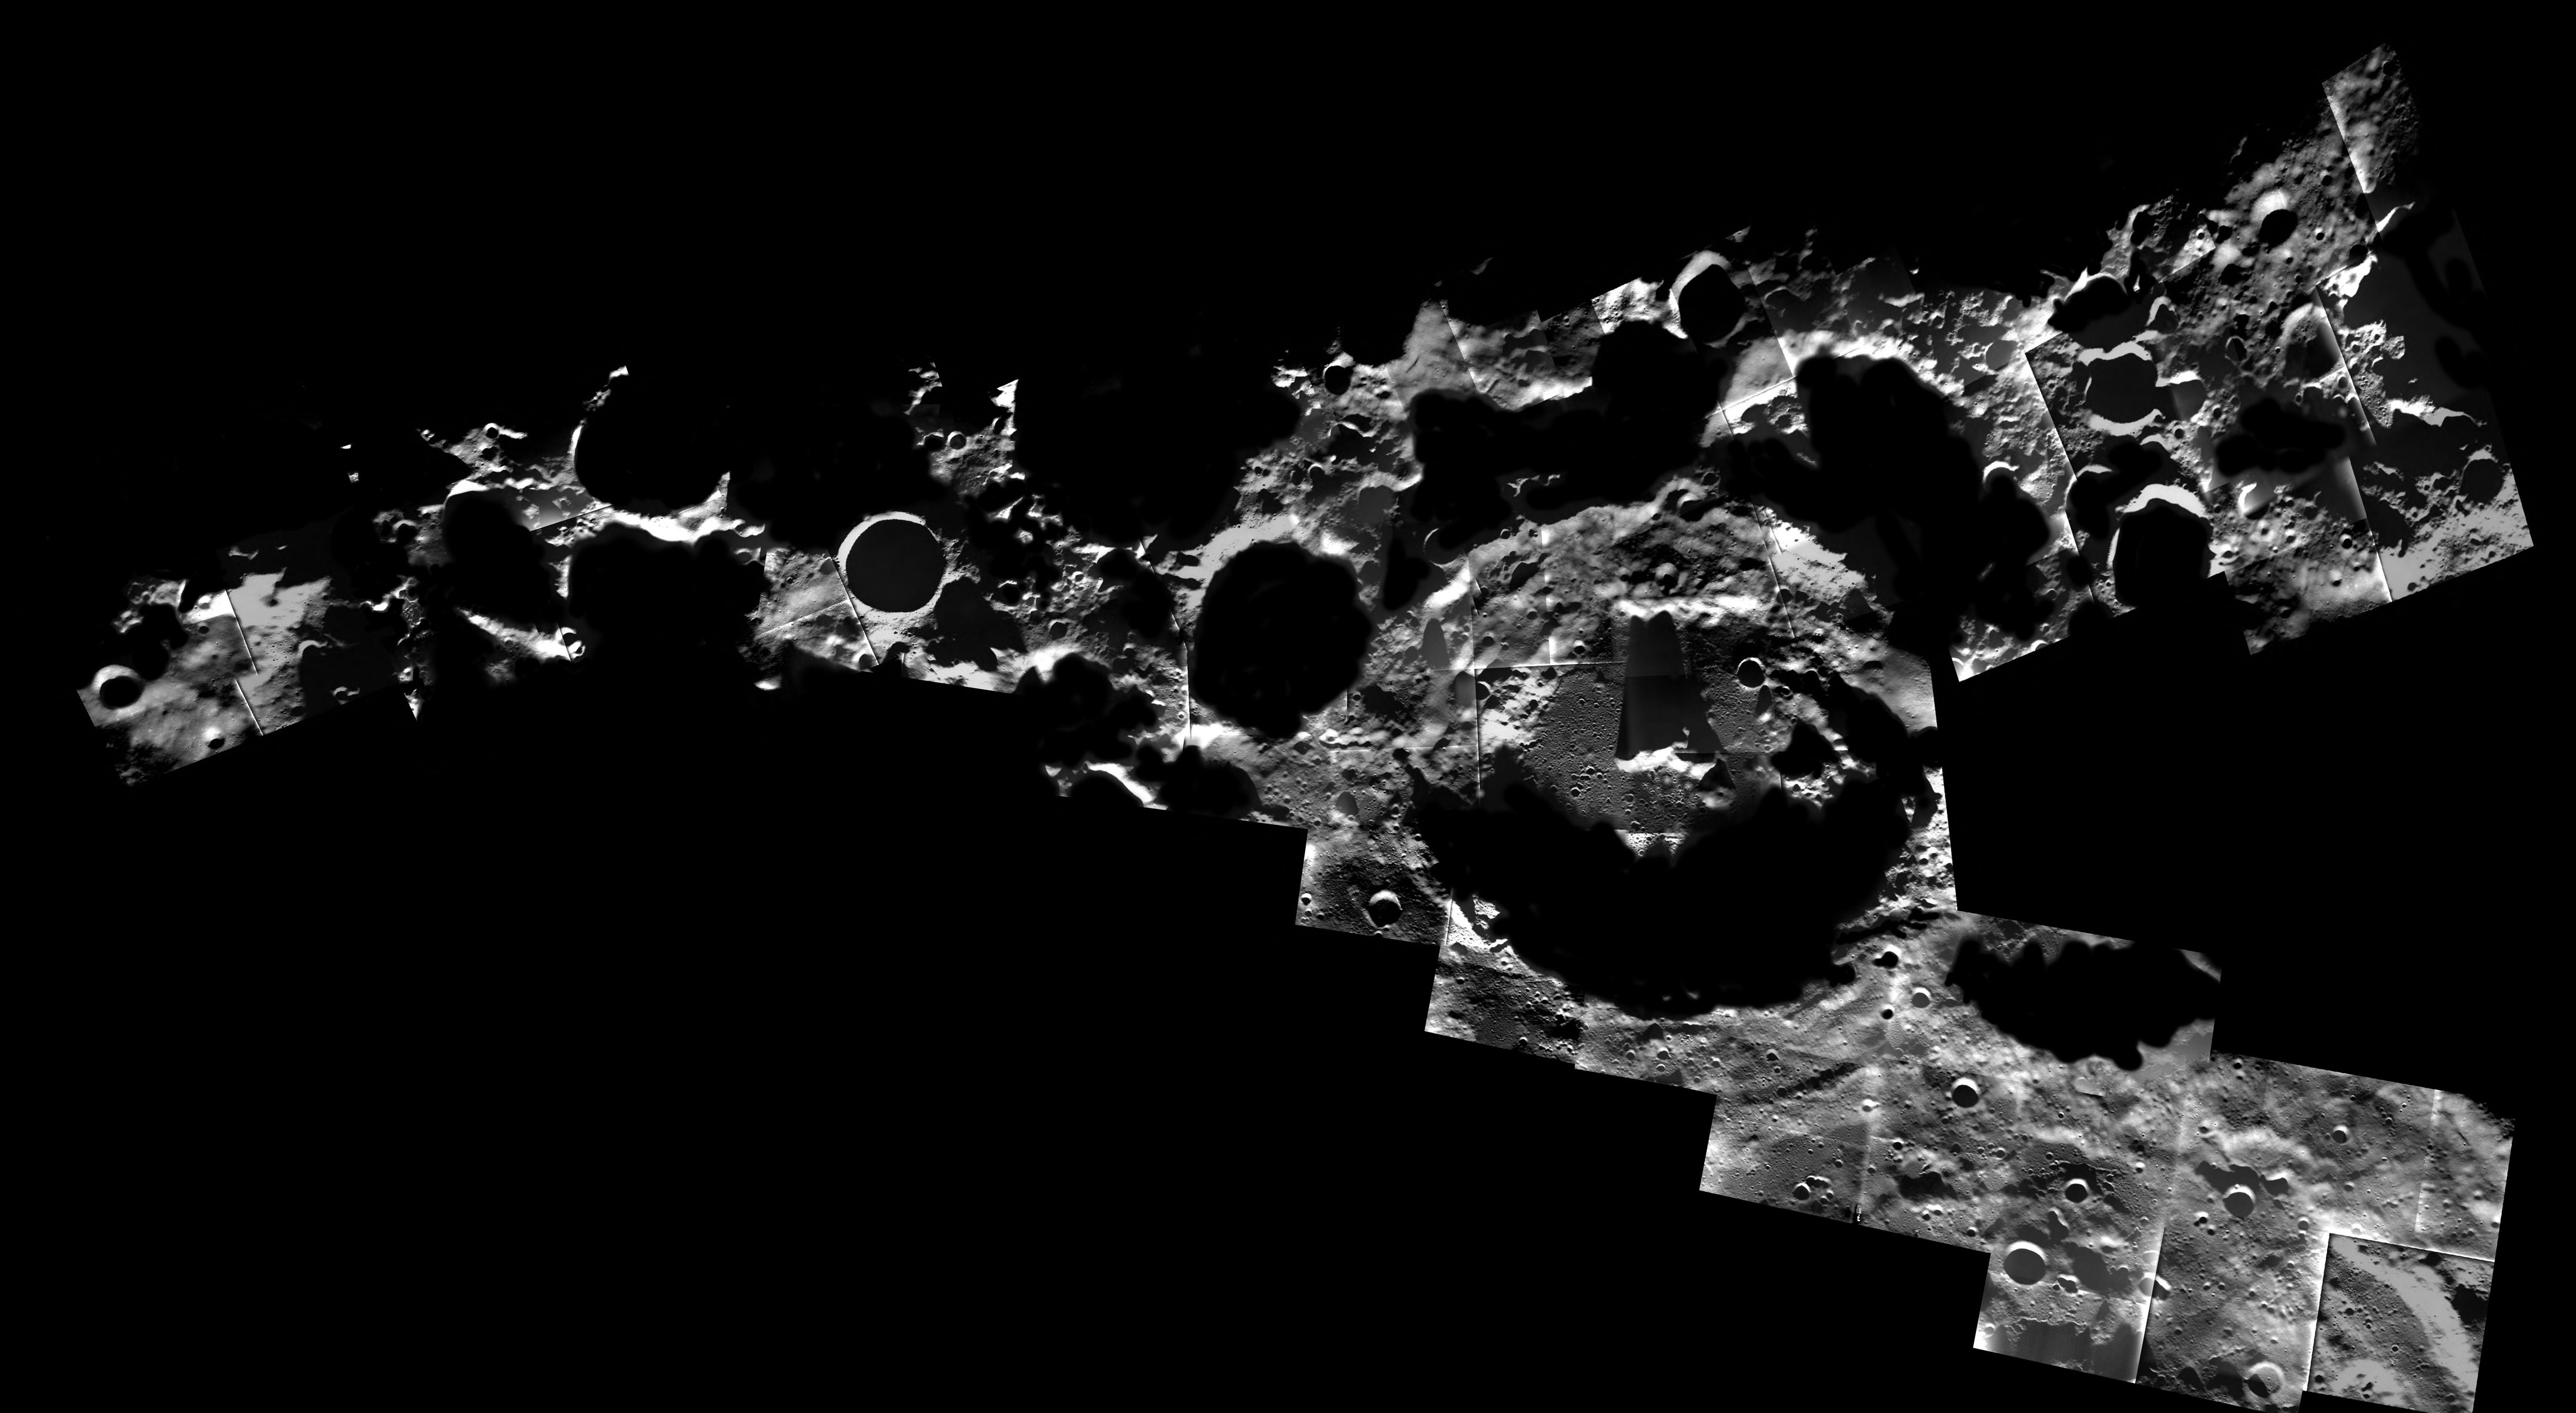
Today's presentations included a lot from SMART-1. In a morning session, [project scientist] Bernard Foing presented a summary of major results. It focused on the increased volume of high resolution data available. In the afternoon, Ben Bussey presented results showing coverage of the South Pole from AMIE, the micro-camera aboard SMART-1. Clementine coverage, previously the best available, was taken during southern winter, meaning that illumination was at its worse. SMART-1 obtained summer coverage, showing much more of the region illuminated.
ESA / SMART-1 / Space-X
South Pole of the Moon from SMART-1
This mosaic of the south pole of the Moon is composed of about 40 images obtained over more than 30 orbits between December 2005 and March 2006 by the AMIE micro-camera on SMART-1. The mosaic covers about 500 by 150 kilometers. The nearside is toward the top of the image, the farside toward the bottom. The large peak-ring crater at center is 105-kilometer Amundsen. To its immediate left, almost completely dark, is 39-kilometer Faustini. To the left of that, a small, circular hole about 19 kilometers across is Shackleton crater, located almost exactly at the south pole.Many seams between individual AMIE frames are obvious in this mosaic. The SMART-1 team left them in because to "erase" them would be to compromise the scientific value of the mosaic. "Erasing" the seams would require painting in faked details, rendering the mosaic even less accurate.
Using Clementine altimetry data, Herbert Frey presented results showing many large lunar impact basins that have not been apparent in image data. Presumably, these are ancient basins that are so degraded as to have almost no remaining features, save a topographic low and possibly a gravity anomaly. Frey said that the upcoming Lunar Reconnaissance Orbiter's Lunar Orbiter Laser Altimeter (LOLA) will provide data good enough to identify such degraded craters down to a scale of ten to twenty kilometers. Additionally, LOLA will be able to identify basins covered by lava flows that have very little remaining topography. The significance is that lunar ages for areas not sampled by the Apollo or Luna sample return missions are dated by comparing crater counts [more craters = older surface]. In addition, other worlds, such as Mars, are dated based on inferred lunar impact rates. Frey's work indicates that we may have significantly undercounted the impact rate in the early solar system, something that would have profound implications for planetary science if it holds up.
In this paper, as well as in a later paper by Stefan Peters based on SMART-1 data, a recurring theme emerged: there is little to no evidence that the so-called Procellarum basin, a large impact feature thought since the Apollo era to underlie the large nearside lava plain known as Oceanus Procellarum (Ocean of Storms), actually exists. There is nothing in the Clementine altimetry to suggest it exists, and Peters' results show that while other basins have subtle rings visible on their lava surface which can be seen under low-sun conditions thanks to their shadows, no such features can be seen related to Procellarum.
There were two papers based on radar data. Bruce Campbell presented an excellent map of the Marius hills, with a resolution of 25 meters per pixel at the 12.6-centimeter wavelength and 500 meters per pixel at the 70-centimeter wavelength. The Marius hills, which are volcanic domes, are clearly visible in the 70-centimeter data, but nearly invisible in the 12.6 cm data. This indicates that despite years of impacts from meteors and micrometeors, there is a significant amount of rock and boulders from the original dome, but most of it is buried under several meters of dust, which makes the hills less visible in 12.6-centimeter data. Vishal Gupta presented a paper showing the different kinds of radar bright and dark rays and aprons surrounding craters and the implications such features had for the surface type.
The highlight of both of these presentations was the spectacular data quality of the current radar maps. Usually the signal is transmitted by the 300-meter Arecibo antenna and received by the 105-meter antenna at Green Bank, West Virginia. The images are available on the PDS Geosciences node, which includes both the raw data as well as more accessible tiff and jpeg images.
Well, that's all I have time for today. I will report in again with tomorrow's highlights.
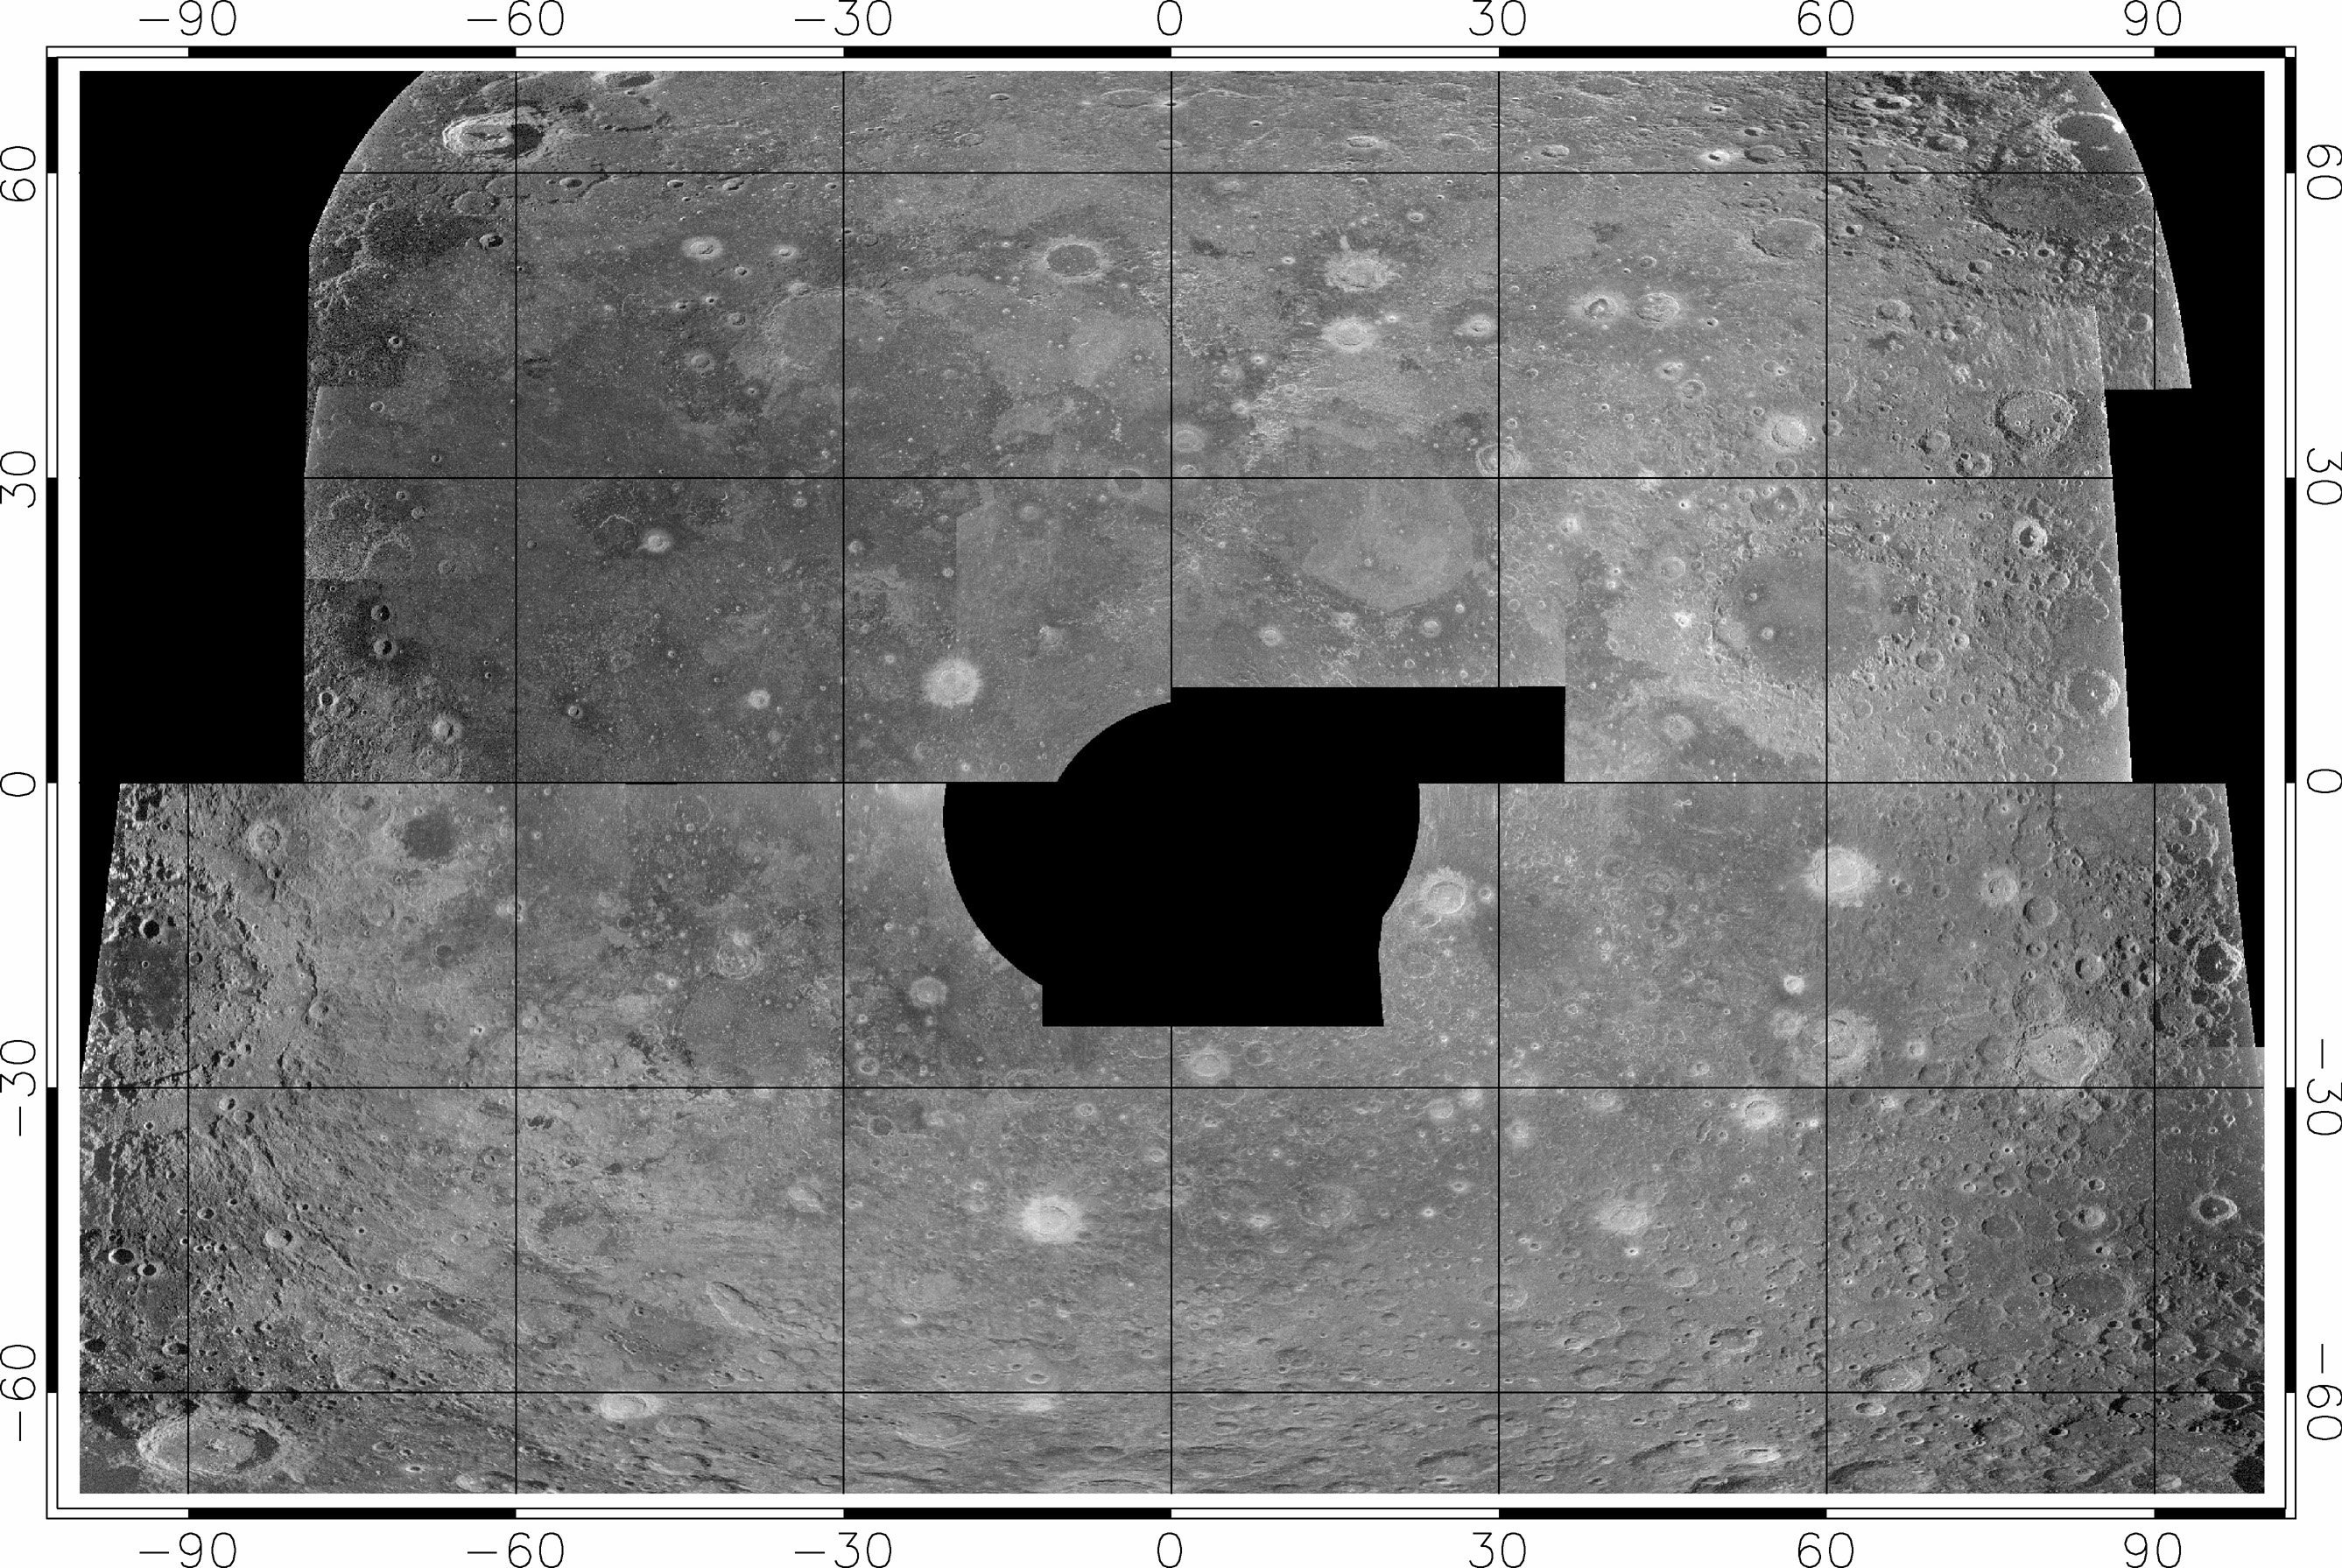
Bruce Campbell et al.
Radar map of the nearside of the Moon
This map of the Moon is based upon radio signals broadcast at a wavelength of 70 centimeters from the 305-meter Arecibo radio telescope in Puerto Rico, reflected off of the Moon, and received by the Robert C. Byrd Green Bank Telescope in West Virginia. The radio waves penetrate up to several tens of meters into the lunar soil, offering a view of the Moon underneath its surface veneer of fine dust. This data is available from the Geosciences Node of the Planetary Data System.Protect Our Shared Future
You help us defend humanity and prevent asteroid impacts. Donate now to become a Planetary Defender!
Donate