
 Explore Worlds
 Find Life
 Defend Earth


My 18-Month Affair With Titan
How I Came to Love Seam-Blending

Written by
Ian Regan
Contributor, Apollo Lunar Surface Journal
October 11, 2018
This article originally appeared on the In Saturn's Rings website and is reposted here with permission.
I’m going to begin by posing a seemingly trivial question. Think, if you will, of a real, existent world in our solar system that boasts all of these attributes: craggy mountains, a thick nitrogen atmosphere, rivers, sand dunes, rain, clouds, lakes, and even seas.
What would your answer be?
Earth, right?
That would be a valid answer, for sure. And since even Mars, as it is today, cannot count off so many terrestrial features, you would be forgiven for thinking that Earth is the *only* correct answer.
But it isn’t. A second world out there also ticks all those boxes—it is Titan, the largest moon of Saturn.
In the cold, outermost reaches of our solar system, where icy, mordant permafrost once was thought to reign supreme, lurks the closest known analog to Earth. Titan is larger than even the planet Mercury, and over the past decade, the Cassini probe has helped lift the veil on this extraordinary and sophisticated world.
I’m Ian Regan, producer of the Titan segment of In Saturn's Rings. Normally, I only play with space imagery and spacecraft data for kicks, but this time I’m working on a project that not only sits snugly in my wheelhouse, but also echoes my personal ethos on astronomical outreach, working as an antidote to the excessive usage of CGI in space documentaries and news reports.
My involvement started back in 2009, when the film existed under the original moniker of OUTSIDE IN. I was approached by Stephen van Vuuren—director, executive producer, and all-round technical whiz—who enquired whether I’d like to contribute some imagery to the project. I readily agreed, and duly supplied him with my scant offerings of a few Saturn mosaics, and other assorted Cassini color composites.
Fast forward four years: having reconnected with the project—now retitled In Saturn's Rings (ISR)—I was hard at work compiling a color time-lapse movie of Jupiter, originally captured by the approaching Voyager 1 spacecraft in 1979. (With over 3,300 color composites to be assembled semi-autonomously, it was indeed a somewhat arduous task.) In so doing, I’d proudly attained the position of one of the film’s many contributing ‘digital artists’.
A TITAN-IC UNDERTAKING
Titan was a key talking point in some the the earliest online exchanges between In Saturn's Rings maestro Stephen Van Vuuren and producer-to-be Dr. Mike Malaksa. The question was this: how could the giant moon be elevated from its also-ran status as one of the film’s supporting artists, to a prominent spot at the top of the bill?
Dr. Mike set the ball rolling by sourcing images suitable for a potential animated descent to Titan's surface. While these early communications set the scene for a putative Titan sequence, no one could have predicted how this segment would eventually consume a considerable chunk of the film’s running time, relegating a planned Apollo segment to the virtual cutting room floor.
In early 2014, while I was still up to my eyeballs in Jupiter imagery, ISR producer Val Klavans approached me for assistance with an embryonic and problematic portion of the film: a virtual photo-animated flyover of Titan. Due to Val’s other responsibilities (chiefly her tireless promotion of the project on every tentacle of social media imaginable), the job of devising a ground track for this flyover fell into my lap by little more than dumb luck.
I rapidly learned this ‘whistle-stop’ tour of Titan had several stringent requirements, as outlined specifically by Stephen VV. They were as follows:
Having consulted maps outlining the available high-resolution radar coverage of Titan (as of early 2014), in conjunction with a shortlist of surface features identified by ISR producer Dr. Mike Malaksa, I sketched out a rough ground track. The virtual camera would embark on its journey from a vantage point high above the hydrocarbon sea of Mare Ligeia, before swooping over a variety of terrain, traversing the farthest extremes of both latitude and longitude, via an almost contiguous path of 15 radar swathes.

GOING RADAR GA-GA
With the ground track greenlit by Stephen and Dr. Mike, my priorities were now two-fold: to download the radar swathes from NASA’s Planetary Data System (PDS) and subject them to a rigorous procedure of restoration and seam-removal.
But first, some background on how this instrument actually operates. Every radar swath is captured by the Cassini orbiter’s SAR instrument, which builds up an image with five separate antenna ‘beams’ of microwave pulses, giving a long, spindly swathe of radar return. The five parallel and overlapping component ‘strips’ exhibit obvious and noticeable seams, and occasionally even gaps. For aesthetic reasons, my goal was to reduce or eradicate the joins between those strips, preserving as much detail and real data as possible.
Lucky for me, the PDS carries a wide variety of radar-derived data. For each swath, I downloaded two distinct products: one with the prefix of BIB is an 8-bit, log-scale conversion of the radar backscatter (aka the actual image), and was deemed most suitable for our purposes. The second data product retrieved was the BIM file: a ‘beam map’ denoting which of the five radar beams (antenna feeds) was used to produce each SAR pixel in a given swath.

Stacking these two images as layers, I could utilize the BIM ‘beam map’ to carve up the radar image into its five constituent parts. Selecting one such ‘beam’, it was fairly straightforward to adjust the histogram and remove any vignetting until adjoining strips matched satisfactorily—rinse and repeat for the other four components! Finally, I used some 'inpainting' software (aka intelligent, auto-cloning) to bridge minor gaps and smoothly blend the joins between the radar strips.
After a successful ‘proof of concept’ test validated my approach, I delegated the job of ‘cleaning’ the 15 principal swathes to ISR volunteer, and amateur astrophotographer, Jacek Bobowik. Jacek’s experience in the arena of deep sky imaging made him eminently suitable for this arduous task. Since 2010, he has processed approximately 100 images, the best of which are on display at his website.
SLICING AND DICING AN ICY MOON
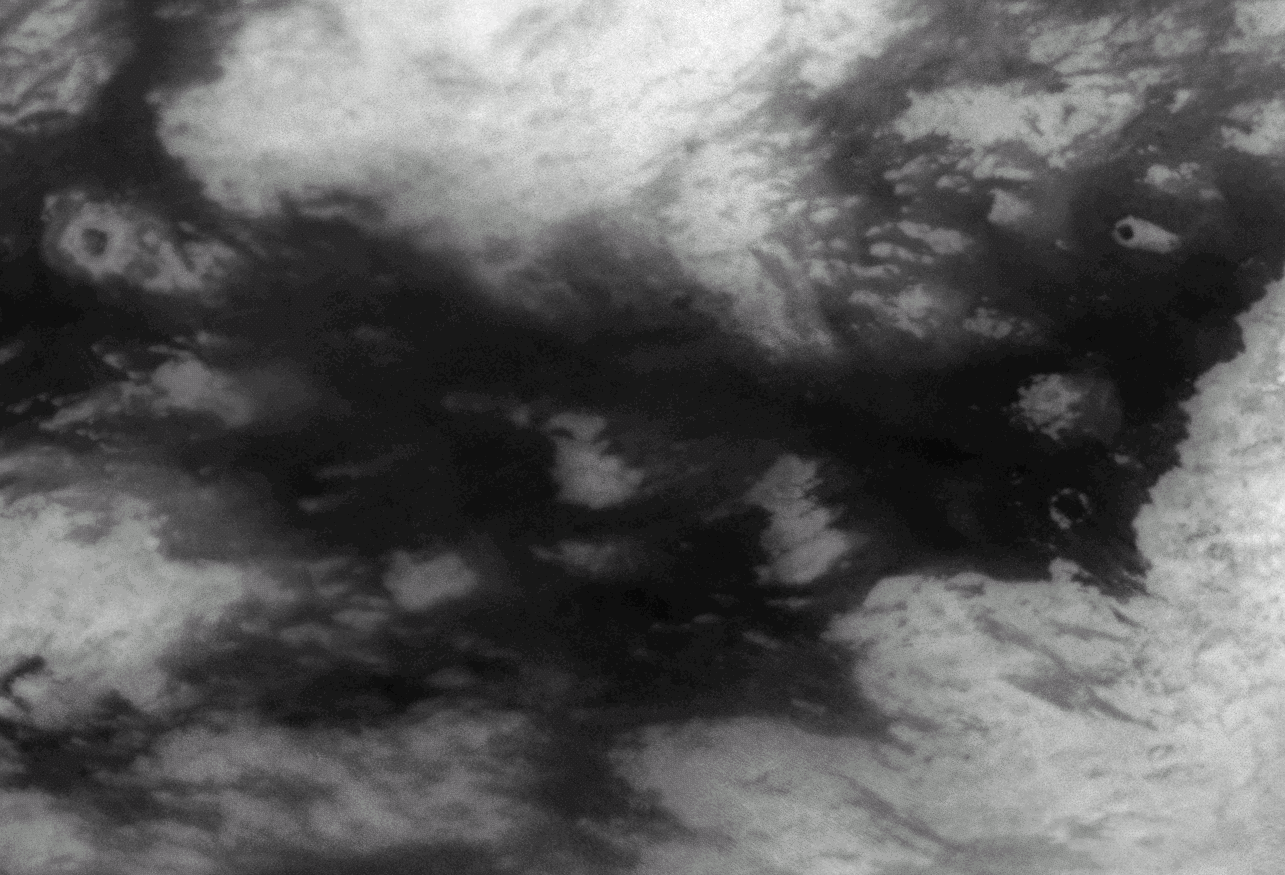
Meanwhile, another issue played on my mind: what to use as a background for the radar swathes? After all, the radar data alone would look unnatural floating on a bland grey backdrop, right? Only one solution suggested itself: a global photomosaic of Titan, consisting of hundreds of images captured by the Cassini Imaging Science Subsystem (ISS) at near-infrared wavelengths. These data, while lacking the crisp, high-resolution detail of radar, would suffice both for context and as a backdrop for the virtual tour.
As of May 2014, the only available data product coming close to satisfying our stringent requirements was the 2013 ‘Controlled ISS Global Mosaic’, produced by the astrogeology department at the U.S. Geological Survey (USGS):
Again, the ever-resourceful Dr. Mike bought this product to my attention. What it possessed in terms of detail (a resolution of up to 100 pixels per degree), it was lacking in other departments. In fact, it needed extensive restoration, cleaning, seam-blending and non-destructive correction for exposure and texture differences between overlapping ISS frames.

A secondary concern was the complete lack of coverage of the polar regions (the mosaic extended only as far as 45° north and 65° south). Despite these drawbacks, and the huge amount of work needed to bring the data up to scratch, this was the only realistic option for a global photomosaic; even the 2015 JPL Photojournal mosaic release (PIA19658) likewise was neither of a sufficient aesthetic quality nor resolution.
With restoration of the radar swathes in the capable hands of Jacek, I focussed my energies on the ticklish issue of repairing the USGS photomosaic.
Prior to the painstaking restoration process itself, I first divided the substantial image (35,952 by 10,987 pixels) into 105 rectangular blocks. Divvying up the mosaic into bite-size chunks helped make the ensuing task more manageable and achievable from a psychological view, and allowed me to gauge my headway with the aid of a spreadsheet.
Tackling the least flaw-ridden ‘blocks’ initially, I hit the ground running and made rapid progress. By this stage in proceedings, I had junked an earlier plan to distribute blocks out to a handful of volunteers, for fear this might prove to be a false economy, and compromise quality control.

AN UN-SEAMLY TASK: FRAGMENT MAPPING
All 105 blocks were mapped, to pinpoint the exact position of the image ‘fragments’ and the seams dividing them. These multi-colored maps could be employed on a separate layer to facilitate easy selection—by way of the ‘magic wand’ tool—of any fragment in any given block. The selection could be matched to adjacent fragments using the typical histogram tweaks, adjustment layers, and masks for especially large fragments. Various bespoke Python scripts helped expedite the process.
Once all fragments in a given block had been normalized to similar brightness levels, the seams needed to be removed. In keeping with the overarching ethos behind the ISR project, usage of the cloning tool was kept to a bare minimum. However, for purposes of seam-blending, an automatic and ‘intelligent’ cloning process — so-called ‘Inpainting’ — was employed. These seam-repairs were then feathered back into the original data.

The final stage in this laborious, and at times frustrating, process was to reassemble the mosaic from all 105 constituent blocks, necessitating further blending and histogram adjustment to ensure neighboring blocks matched seamlessly. This whole undertaking, from sourcing the original data to the final reconstruction, took just shy of five months (May to October, 2014).
Due to issues inherent in the original mosaic, some areas — most notably the distinctive dune fields of Fensal and Aztlan and their environs — required further attention. I scurried off back to the PDS and retrieved raw data to enhance and improve this region. To the author’s surprise, a second such repair revealed a bright semi-circular albedo feature lurking south of Adiri in the temperate zone.

I was especially pleased at the improvements extensive restoration wrought to the iconic Fensal-Aztlan district: the result of 11 co-registered and processed Cassini ISS frames—and nary a sniff of a clone brush anywhere.
POLAR BUG-BEARS
Another challenge was the, ‘equidistant’ equatorial projection of the USGS mosaic. The pitfalls of overlaying the SAR swaths, with no re-projection or warping, onto a rectangular ISS basemap, seemed obvious. Particularly, swathes located near the poles could not conceivably be overlain on such a projection without serious misalignment between the SAR and ISS data.
Therefore, I pitched my solution to Stephen and Dr. Mike: divide the ISS basemap into three sections—polar projected discs for the northern and southern hemispheres, and the standard rectangular projection for the equatorial region.
In this scheme, the polar regions could be rotated and repositioned whenever the virtual camera ventured toward the higher latitudes (many of Titan’s most interesting features lie within a snowball’s throw from the poles). The temperate latitudes could be covered by either the polar or equatorial basemaps, giving Stephen additional flexibility when manoeuvring his virtual camera.
With Stephen’s assent, I duly constructed a ‘storyboard’ of sequential step-by-step thumbnails, detailing each stage of the flyover, showing how the virtual camera’s tour along the radar strips was to be co-ordinated in relation to the three variations of the basemap.

HI-LATITUDE HI-JINKS
The north and south polar regions now loomed large on the horizon. In the final months of 2014, as the restoration of the USGS mosaic came to fruition, I made plans to fill those empty voids. I resolved to take a slightly different approach to each region: the gap at the south pole would be covered with an upscaled version of the 2011 JPL mosaic (PIA14908), while the north pole would be a merger of three JPL Photojournal mosaics (PIA17472, PIA17473 & PIA18421).
Unfortunately, the results were not satisfactory, and barely fit for purpose. I blame this on inadequate preparation, getting burned out by the USGS restoration, and rushing the process to meet a December deadline.

However, with delays in the ISR pipeline building up, I decided to spend the first weeks of 2015 investigating the possibility of reconstructing the poles from scratch. Quite frankly, it was a task I’d dreaded, meaning as it did trawling through the seemingly bottomless depths of the Cassini archive, by way of the Outer Planets PDS search tool (OPUS), looking for suitable frames to construct polar mosaics that could be blended seamlessly with the newly-restored USGS data product. Also, working with these data was notoriously difficult, hit-and-miss, and replete with numerous hurdles to overcome. It was definitely a steep learning curve!
I started by creating a rudimentary catalog of all ISS frames taken through the continuum (or CB3) filter of Titan, in which the surface is best visible. Utilizing this catalog, I identified the best individual observations and began brainstorming processing methods to tease out low-contrast features while minimizing noise. In so doing, I employed the technique described by Perry et al.,(2005), in which a stack of co-registered CB3 frames is divided by a lone MT1 filtered frame (which records only the atmospheric haze).

These processed frames were then integrated into a polar-projected photomosaic, using a JPL radar mosaic to align and co-register the ISS frames to a positional accuracy of two to three miles.

Medium-resolution imagery made up most of the north polar mosaic, with the exception of an area near Titan’s lake district, which Cassini captured in exquisite detail in December 2013:

Given the geometry of most Titan flybys over the northern latitudes, high and medium resolution frames from Cassini covered all areas except for a significant area on the Saturn-facing hemisphere; this region, which includes the distinctive ‘scorpion's tail’ extent of Kraken Mare, has only been glimpsed from oblique angles or from distance: neither conducive to capturing good imagery. The author had no option in this regard but to resort to upscaling and stacking the many global images of Titan taken by Cassini in September 2013. This resulted in a suitable super-resolution view of this most camera-shy of Titanic real estate.

FRAMES, FOOTPRINTS, and MOSAICS
I discovered the optimum method of stitching these processed ISS images together was to split each image into it’s high- and low-frequency constituents, using low and high pass filters. Judicious usage of histogram adjustments and the eraser brush on the low-passed data, combined with more cautious scalpel-like incisions and minor contrast tweaks to the high-pass details, resulted in a near perfect blend between adjoining image tiles. Artificially generated noise could even be added to further smooth the transition, if necessary.

Small regional mosaics were gradually built up thusly, until the entirety of the polar regions were covered with high-contrast, and well-defined photo imagery. A similar recipe of low-pass and hi-pass filtering helped facilitate blending the completed polar mosaics with the restored USGS data.

Alas, the thick Titanic haze plays havoc with incident solar illumination of the surface. On an airless body, sunlight reveals surface albedo in a straightforward manner. Yet with Titan, sunlight bounces off the surface, then the underside of the haze, and back and forth. At higher latitudes, the incoming sunlight arrives at increasingly oblique angles and scattering becomes even more of an issue.
This cosmic game of ping-pong has consequences for images taken of the same region, but at different times: features can look more or less prominent (i.e., darker or lighter), with respect to their environs.
So with this in mind, equalizing the brightness levels between adjacent images was very much a non-trivial problem. I resorted to copious amounts of non-scientific eye-balling, using distant, global Cassini frames for reference.

THE INEVITABLE HAPPY ENDING
In January 2016, Stephen Van Vuuren took delivery of the final image products needed to construct the majority of the film’s Titan sequence, including six Titan ISS photomosaics, each at a scale of ~100 pixels-per-degree:
As a final flourish of sorts, I created a Titan map, consisting of a rough merge of the processed radar and ISS data, for import into Celestia: a 3D astronomical desktop application. I then programed and recorded a rudimentary flyover of Titan, following the ground track I had devised with Dr. Mike’s input some 2 years previously, and which buzzed the landforms and Earth analogs he had identified.

This allowed Stephen to watch, for the very first time, an embryonic visualization of the Titan segment. This video, in my eyes, marked a truly important milestone along the road to the completion of the film: it validated the choice of ground track, and in so doing, justified the many, many hours of work invested in producing the best possible imagery within the author’s relatively limited capabilities.
As a final validation of the ISS photomosaic, Celestia also allowed me to simulate various iconic Cassini ISS images of Titan, and compare the views side by side. I’m happy to report the mosaic passed this test with flying colors!

The final piece in this uniquely Titanian puzzle was a mosaic of images taken by the ESA’s Huygens probe as it glided down to the moon’s surface in early 2005. IN SATURN’S RINGS volunteer and image-processing wizard Daniel Macháček was tasked with the undertaking of combining these low-resolution and noisy images. Given his pedigree, I am veritably confident the end product will be a magnificent finale to our filmic love-letter to the jewel in Saturn’s array of icy attendants.

EPILOGUE
Thus ended a period of almost continuous work on the film, one which spanned from May 2014 through January 2016. The reader may wonder how many hours I’ve expended altogether on this project. In reality, it’s an impossible number to calculate...indeed, I've invested so much time learning to process the Titan ISS PDS imagery from scratch.
For many people in the astronomical community, 2015 was the year of the dwarf planet, when robotic emissaries from Earth reached and explored the worlds of Ceres and Pluto for the very first time. This author was even interviewed by the BBC about the Pluto flyby only two days prior to closest approach!
Nonetheless, for me 2015 will always be the year I got to know (and maybe even slightly fell in love with), the strange and bizarre landscapes of Saturn’s largest moon: the smog-enshrouded, enigmatic, yet strangely familiar world of Titan.

POSTSCRIPT
With film-making being a highly unpredictable art form at the best of times, trying to second-guess what will and what won’t make the final cut is always a ‘roll of the die’ affair.
Eight months have passed since I originally penned this article. In the interim, the Titan segment of IN SATURN’S RINGS has changed a great deal. It’s now shorter, tighter, and punchier, utilizing mosaiced and stacked radar data. The groundtrack has been truncated and reversed: we now begin our tour at the Huygens’ landing site, before swooping past the Belet sand dunes and Ligeia Mare en route to the final destination of Ontario Lacus.
It’s tough to see so much cut out. But in the end the right decisions were made, as the segment as planned would have bogged-down the film. It’s better to be succinct and memorable, especially when this will serve as an introduction to Titan for a large percentage of the audience. Less is often more!
Cassini’s death plunge into Saturn, last September, prompted me to sit down and assess the final images of Titan’s north pole, captured during the mission's twilight period. It turned out a plethora of newer ISS imagery offered the possibility of upgrading the global Titan photomosaic—chiefly the area around Kraken Mare’s ‘scorpion tail’.
Even though this area would not appear in the film, I decided to incorporate this data—24 frames in total—to produce the definitive restored version of the 2013 USGS mosaic. Official and better global portraits of the king of Saturn’s moons will no doubt be made in time, but for now this is probably the ‘best’ view of Titan to be had (‘best’ here means achieving a happy balance between reasonable scientific accuracy, resolution, and aesthetics).
Now, to await the premiere!

Protect Our Shared Future
You help us defend humanity and prevent asteroid impacts. Donate now to become a Planetary Defender!
Donate