Map of the Moon's crustal density inferred from GRAIL's gravity map
Filed under
explaining science,
the Moon,
GRAIL,
geology,
gravity
Go Back
This graphic depicting the bulk density of the lunar highlands on the near and far sides of the moon was generated using gravity data from NASA's GRAIL mission and topography data from NASA's Lunar Reconnaissance Orbiter. Red corresponds to higher than average densities and blue corresponds to lower than average densities. The average bulk density of the lunar highlands crust is 2,550 kilograms per meter cubed, which is 12 percent lower than generally assumed. White denotes regions that contain mare basalts (thin lines) and that were not analyzed. Solid circles correspond to prominent impact basins. The largest basin on the moon's far side hemisphere, the South Pole-Aitken basin, has a higher than average density that reflects its atypical iron-rich surface composition.
NASA / JPL / GSFC / MIT / IPGP
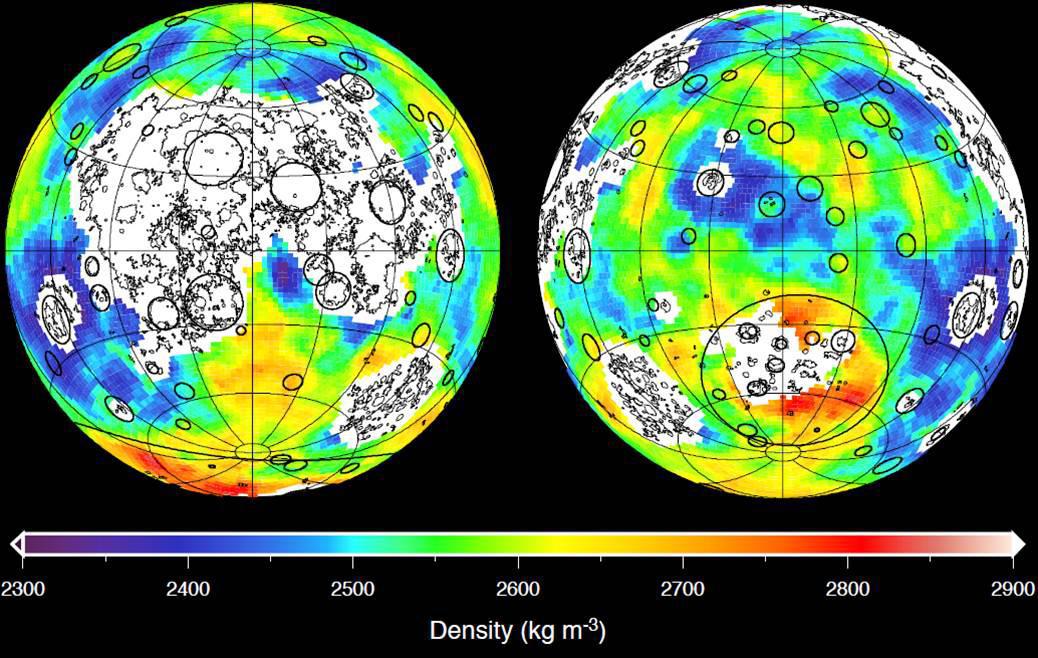
Data are presented in two Lambert azimuthal equal-area projections centered over the near (left) and far side (right) hemispheres, with each image covering 75 percent of the lunar surface.
Original image data dated on or about December 5, 2012
Comments:
Leave a Comment:
You must be logged in to submit a comment. Log in now.