Flying By Home
Testing OSIRIS-REx’s Tools on the Way to Asteroid Encounter
Vicky Hamilton is the head of OSIRIS-REx’s Spectral Analysis Working Group.
Every time a planetary spacecraft turns to take a picture of Earth on its way to a new destination, it’s a reminder of how spectacular a place our home planet is. When NASA’s OSIRIS-REx mission flew past Earth on its way to the asteroid Bennu in September 2017, we observed a planet primarily covered by water, whose atmosphere included water vapor, carbon dioxide, ozone, and methane. If we were an alien species, we might infer from the atmospheric temperature and the presence of water and carbon dioxide that Earth is a habitable planet. Of course, we’re not an alien species, and we knew these things about Earth already. Why would you take a spacecraft designed to study a distant world, launch it on an interplanetary trajectory, and then point its instruments at Earth?
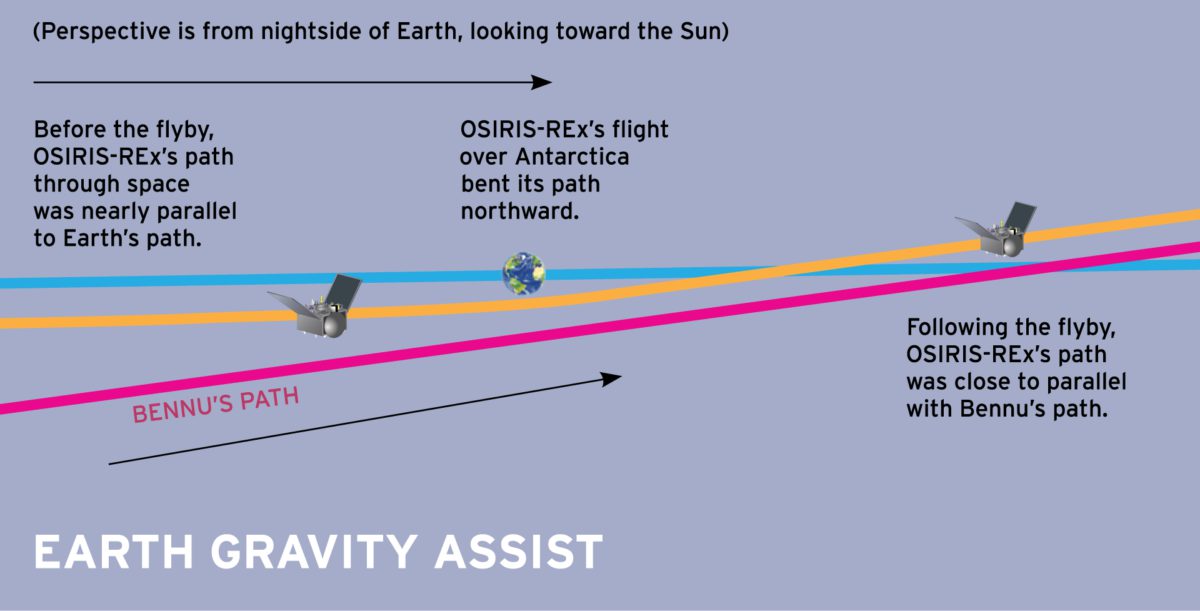
As many spacecraft do, OSIRIS-REx returned to Earth a year after launch for a gravity assist. For OSIRIS-REx, the Earth gravity assist was a critical part of the journey to Bennu, enabling the spacecraft to leave the plane of Earth’s orbit and enter that of Bennu’s so that we could ultimately rendezvous with this tiny bit of rock.
Just being in the neighborhood isn’t a good enough reason to take data on Earth. OSIRISREx stands for Origins, Spectral Interpretation, Resource Identification, and Security–Regolith Explorer. The top priority of the OSIRIS-REx mission is to return a pristine sample of carbonaceous material. Observations of Earth are not a mission requirement, nor were they even in the original mission plan. The science team engaged in lengthy discussions with the spacecraft engineering team about whether we could collect such data.
There is a significant—albeit collegial and professional—tension between the scientists who want to make such measurements and the engineers whose job it is to ensure the health and safety of the spacecraft. The spacecraft engineering team was understandably reluctant to add any unnecessary activities ahead of and during the critical Earth flyby maneuver in order to avoid anything that might put the spacecraft’s arrival at its ultimate destination at risk.
On the other hand, as the scientists who built the instruments that will make the measurements at Bennu, we had not had an opportunity to assess how the instruments performed after launch. We also wanted to verify the alignment of the instruments relative to each other and to the spacecraft so we could correct any differences in pointing. Together, the OSIRIS-REx scientists and engineers worked out a plan that would allow for safe passage by Earth, followed shortly after that by an opportunity to turn on the science instruments and collect data on our home planet.
OSIRIS-REx’S INSTRUMENTS
Our spacecraft carries five science instruments to map the topography, geology, mineralogy, and chemical composition of the asteroid, providing context for the returned sample and comparison data for similar asteroids. They also identify hazards to the spacecraft and sampling system and help determine the optimal location for collecting a sample.
Two of the 5 instruments did not operate during the Earth gravity assist. The Regolith X-ray Imaging Spectrometer (REXIS), which will map chemical elements on Bennu, launched with a cover that had not yet been opened. The OSIRIS-REx Laser Altimeter (OLA) will inform our understanding of the detailed shape of Bennu; it needs to be within 7 kilometers (4 miles) of its target to collect data. Unfortunately for the OLA team, the Earth flyby distance of 17,237 kilometers (10,711 miles) was too large.
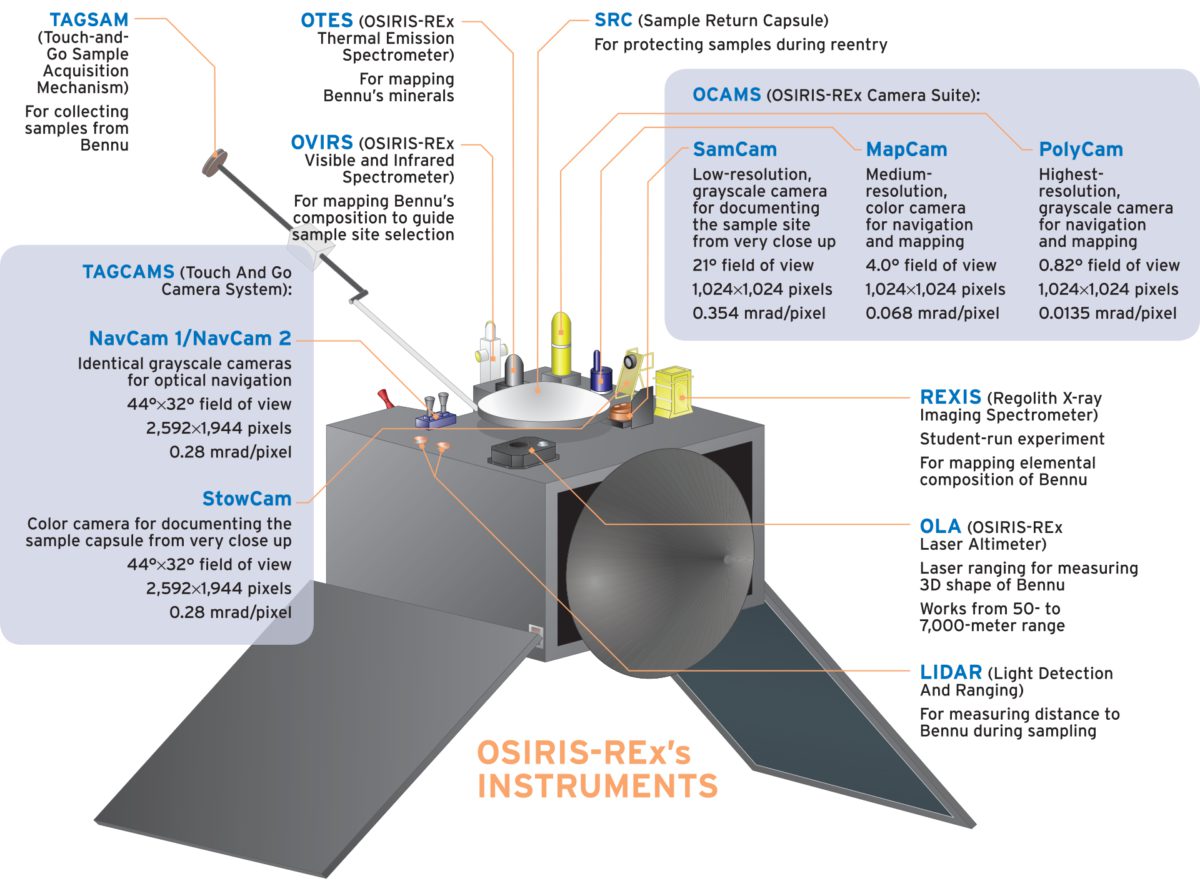
The OSIRIS-REx Camera Suite (OCAMS) will take pictures of Bennu so we can identify any geologic features on the asteroid as well as perform a detailed inventory of hazards such as boulders that could prevent successful sampling. The Earth observations provided an opportunity to characterize the cameras’ performance and to exercise the image-processing techniques for mosaicking and color-image production.
Complementing the visual images, the OSIRIS-REx Visible and Infrared Spectrometer (OVIRS) and the OSIRIS-REx Thermal Emission Spectrometer (OTES) will map the mineralogy and chemistry of Bennu. OVIRS and OTES looked at deep space during our cruise to Bennu. However, space has no spectral features, so those data only show that the instruments are operational. To really understand the postlaunch quality of the spectral data (radiometric and spectral calibration) and the alignments of the instruments (to the spacecraft and to each other), we needed to look at an object that has spectral features. The best extended object along our path to Bennu was Earth because we already knew what we should see. Ultimately, that was the justification for capturing data on Earth following our gravity-assist flyby.
Post-Flyby Science
We scheduled our Earth and Moon observations for 4 different periods across the 10 days after the flyby, in part to hedge against any anomalies that might preclude making observations immediately after the closest approach to Earth.
The gravity assist went smoothly. A few hours after our closest approach to Earth, the camera suite and spectrometers turned on to warm up. All of the instruments are fixed to the spacecraft—they’re not steerable—so the spacecraft has to move to point us at different locations on Earth.
Starting about 6 hours after the flyby, the spacecraft scanned east to west and north to south across Earth. We called these the “EGA+1” observations, where “+1” signifies the first day after the Earth gravity assist. For EGA+1, the spacecraft was still quite close to Earth (still inside the orbit of the Moon), and Earth completely filled the fields of view of the spectrometers. The scanning motions allowed us to use the limb or “edge” of Earth (which is very different than looking at deep space) to verify whether the pointing of each instrument was consistent with what was measured before launch and also to compare the pointings of the instruments to each other. We did not observe the Moon because while we could see Earth nearly fully lit, the Moon was only a thin crescent.
As Earth receded from view, we made additional observations on days EGA+3, EGA+6, and EGA+10. As EGA+3 began, we were 1.2 million kilometers (750,000 miles) from Earth, and we could see the sunlit farside of the Moon. The Moon was far enough away that it only filled 15 to 25 percent of our instruments’ fields of view, making the signal weaker. Still, these observations allowed us to verify the alignments and performance of the OCAMS, OVIRS, and OTES instruments.
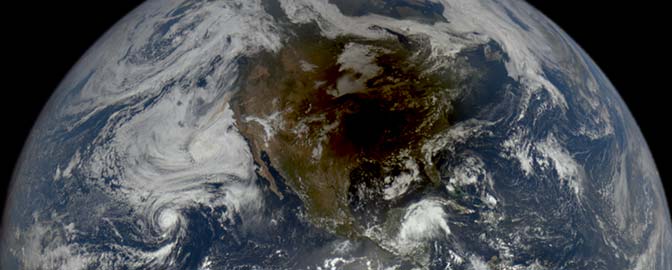
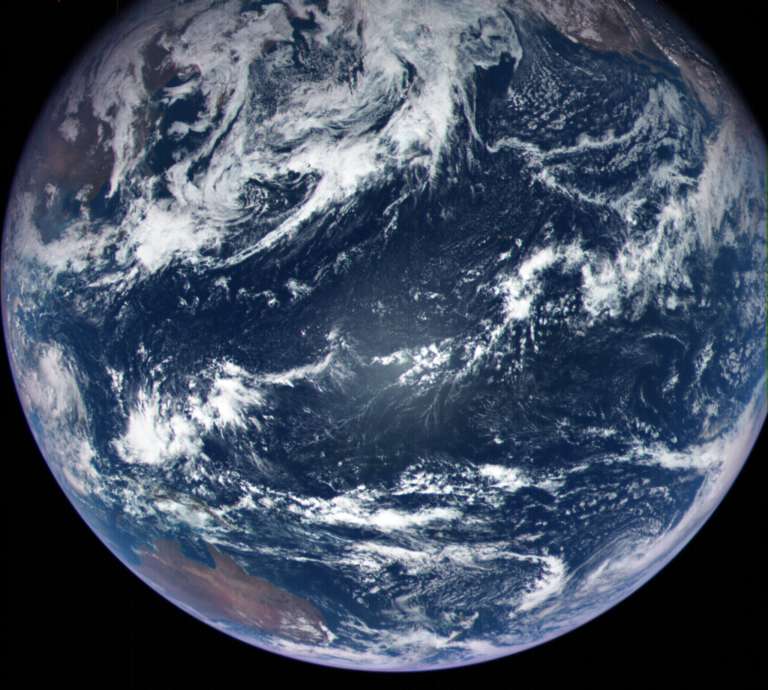
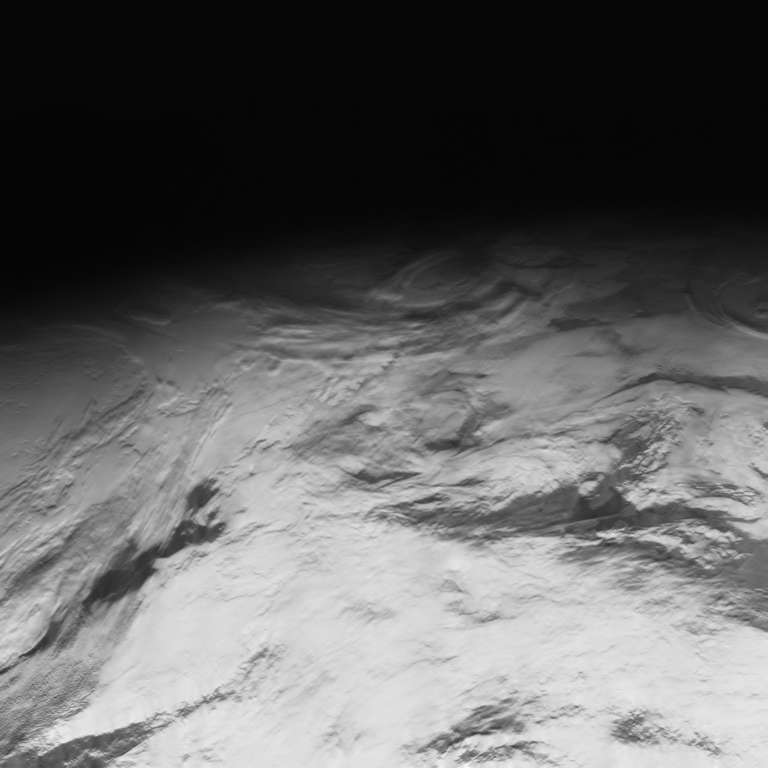
OCAMS can take pictures of stars during our cruise to Bennu to demonstrate that it is working well, but Earth observations allowed OCAMS to fully exercise MapCam’s color filters. Our perspective on Earth after the flyby was dominated by the Pacific Ocean. Looking at Earth, OCAMS saw what we recognize from daily weather satellite images as deep-blue water, hints of brown or greenish land masses around the edges, and contrasting bright, white water-vapor clouds. In fact, Earth’s clouds are so bright that they challenged our camera because we designed OCAMS to be sensitive enough to take photos of Bennu, whose dark surface reflects at most 4 percent of incoming sunlight. Even though we used short exposures, parts of some of the OCAMS images of Earth are overexposed. They are, nonetheless, beautiful.
OVIRS will measure how Bennu reflects visible and near-infrared wavelengths of sunlight (see sidebar). Like OCAMS, OVIRS was designed to look at dark Bennu, not bright Earth, so we commanded OVIRS to take spectra rapidly. Although OVIRS could have detected minerals on Earth’s surface, our field of view at midnight UTC contained almost entirely ocean. Our EGA+1 data primarily show atmospheric constituents: water vapor and carbon dioxide.
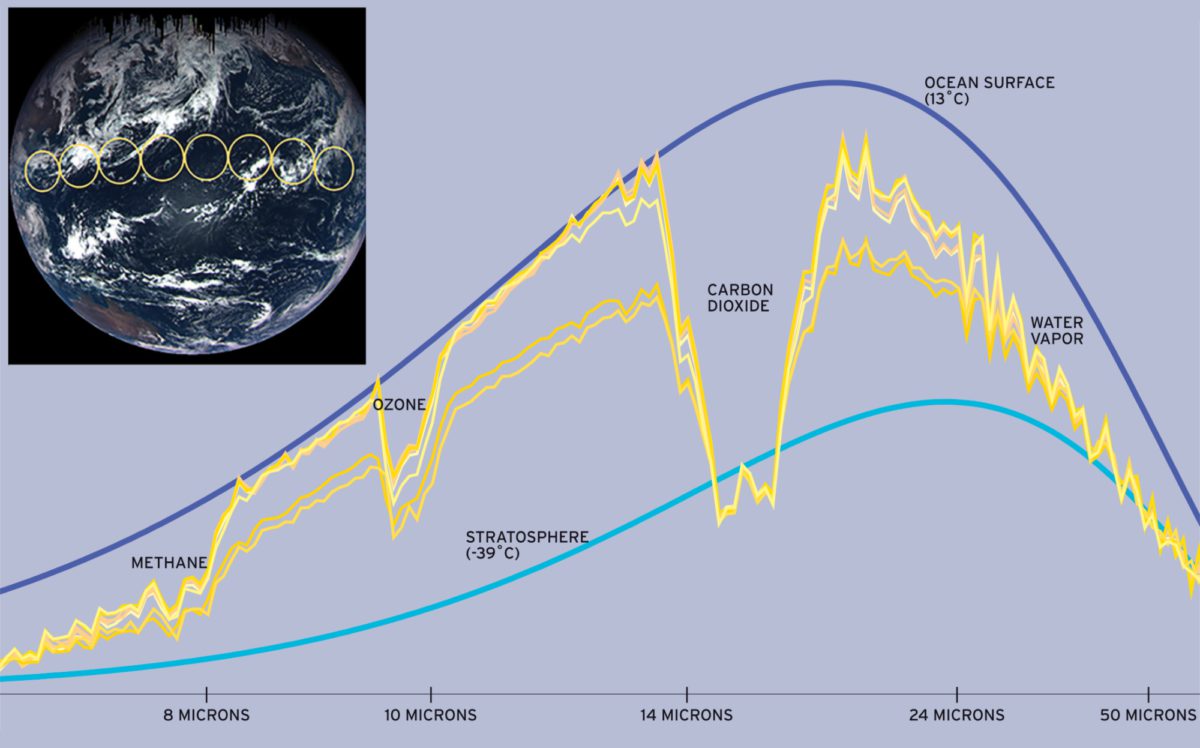
INSET: The OTES instrument gathered its spectral data at nearly the same time that MapCam took this photo. The yellow circles, each 800 kilometers (500 miles) in diameter, show the approximate locations and sizes of the spots on Earth scanned by OTES to produce these curves.Image: NASA / GSFC / UA / ASU / The Planetary Society
OTES will measure the energy emitted by Bennu in thermal infrared wavelengths (see sidebar). It can detect a wide array of minerals as well as provide information about the temperature of the asteroid’s surface. Surface temperature— and how rapidly it changes from asteroid days to nights—can tell us about the size of particles in the uppermost surface. Earth’s atmosphere also has spectral features in this wavelength region from water vapor, carbon dioxide, ozone, and methane gases, which means that OTES also saw spectral features we don’t expect to see at Bennu.
Scientists studying Earth’s climate use remote- sensing measurements similar to these to track changes in the spatial distribution and abundance of atmospheric constituents over time. For both OVIRS and OTES, we successfully used the known spectral features of Earth’s atmosphere to verify our radiometric and spectral performance. Because our spectrometers are designed to measure the spectral features of minerals and organics that typically have much wider absorption bands than atmospheric gases, we can’t use our data to say much that is new about Earth’s climate.
Let’s Go Beyond The Horizon
Every success in space exploration is the result of the community of space enthusiasts, like you, who believe it is important. You can help usher in the next great era of space exploration with your gift today.
Donate TodayThe Planetary Report • December Solstice
Help advance space science and exploration! Become a member of The Planetary Society and you'll receive the full PDF and print versions of The Planetary Report.


 Explore Worlds
 Find Life
 Defend Earth