
 Explore Worlds
 Find Life
 Defend Earth


Topography on Titan
Written by
Emily Lakdawalla
April 2, 2008
On Monday, with no fanfare, JPL posted the first detailed topographic map of part of Titan. I suppose the map doesn't strictly qualify as a pretty picture, but it is a tremendously important data set. We just don't have a lot of reliable topographic information on Titan because the thick atmosphere scatters light so much that camera images fail to show us shape from shading. And without topography, it's really hard to describe Titan's geomorphology, and without that it's hard to describe Titan's geologic history.
NASA / JPL / USGS
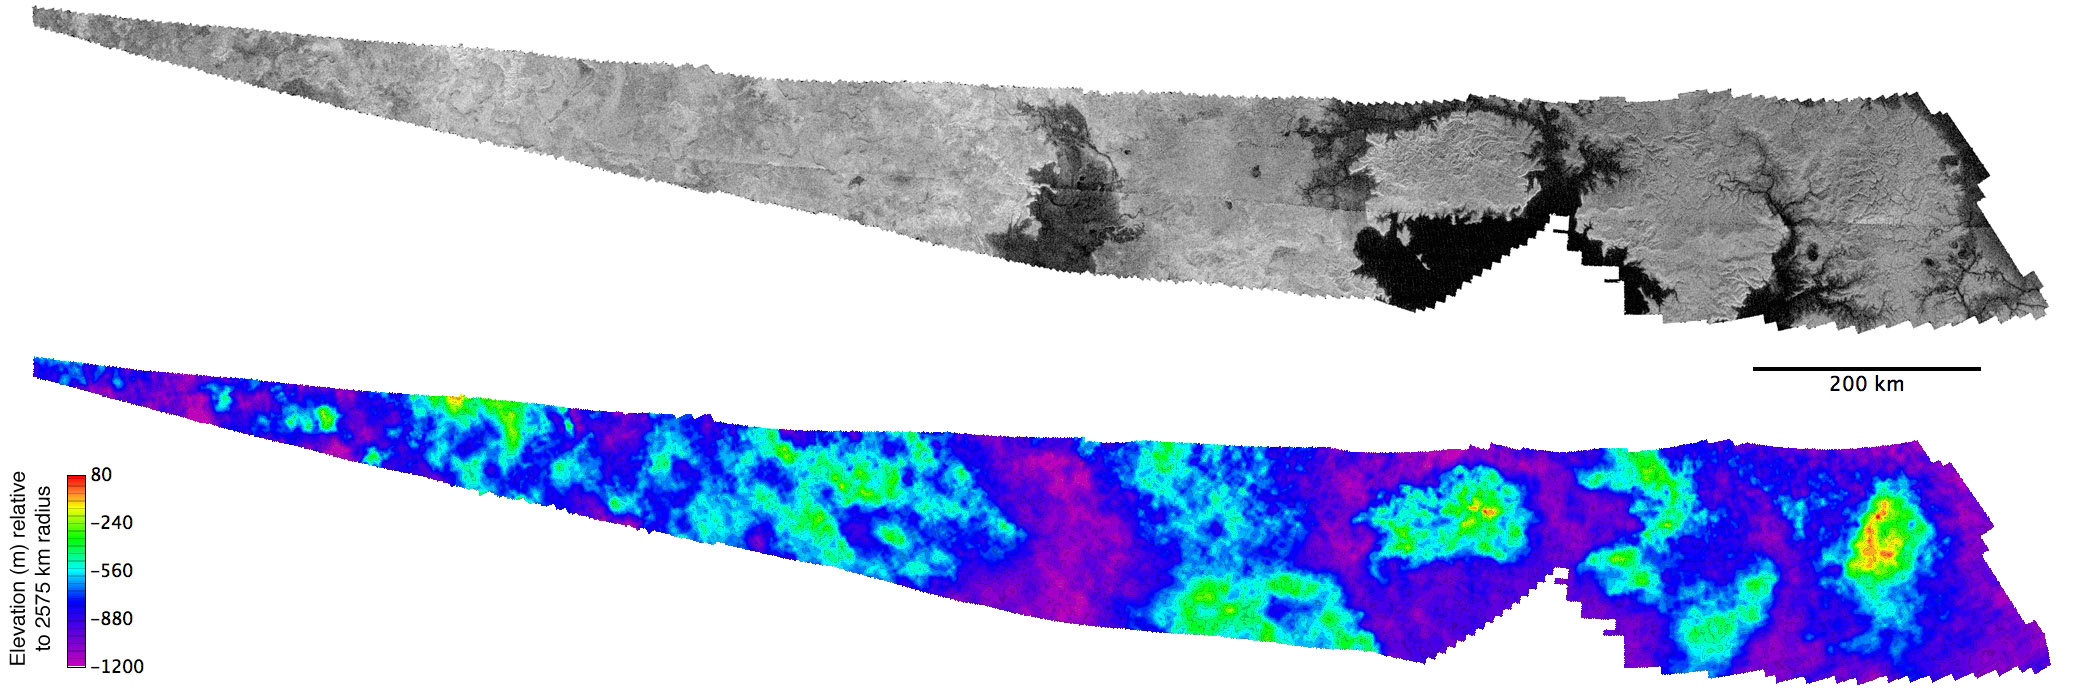
Topographic map of lakes on Titan
The image strip on the top of this map is the area of overlap between two SAR swaths across Titan's north polar lakes region that were acquired within weeks of each other: the February 22 and April 11, 2007 flybys (T25 and T28). Using a computer program that matches terrain features in the two images, workers at the United States Geologic Survey produced the topographic map of the region shown below it.Let's zoom in on the interesting area to the right-hand end of the map, the part of the swath nearest the pole that crosses some of the biggest lakes.
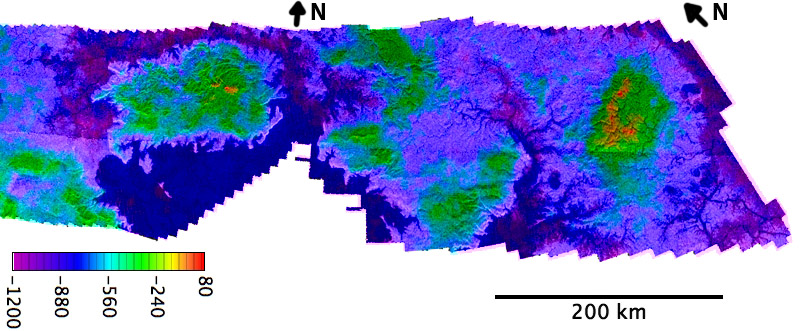
Topographic map of lakes on Titan
Another similar test is to ask: do the river-channel-like features lie in valleys? And, do their sources lie uphill from their mouths? Again, the answer seems to be yes; the biggest and most obvious channels are almost as low as the lakes, while smaller channels seem to radiate off of topographic highs. All in all, I think this map provides a very solid line of evidence that the exceptionally radar-dark materials near Titan's north pole represent fluids ponded in reservoirs fed by tributary streams in which the fluid flows by gravity from regional highs to regional lows. Phew!
But there's something I find very curious. The left side of my detail map is dominated by a very dark lake with a very big "island" sitting in it. In fact, much of the lake is so dark that the computer algorithm that the guys at the USGS were using to match the two overlapping swaths and create the topographic map couldn't find anything to match, so there's a big bite out of the topographic map in that area. That's what you would expect from a body of liquid -- it should be flat and featureless. But as you approach the island, there is actually quite a lot of detail in the topographic map. And though it has a slightly speckled character that made me think that some of this might be noise (areas where the topographic-map-generating algorithm got confused and tried to match random flecks in the original SAR data), there is actually quite a bit of topography represented in that data, and it seems to organize itself into some pretty deep lows. What's oddest is that the deepest lows aren't in the blackest lake, but instead are found in the regions to the north of the island, where you can still see fluvial features.
I sent an email to Randy Kirk at the USGS, who was kind enough to take the time to answer my questions (and followup questions!) in great detail. He said: "We were pleasantly surprised that the completely computerized stereo matching process returned results in so much of the lakes. Some of the areas that are darker than the majority of the 'land' still have quite a bit of obvious detail in them. An example would be the area north of the prominent island. There is no reason that comparing the images shouldn't give some kind of elevation information here.
"Furthermore, I've evaluated the physics of doing radar parallax measurements through a layer of liquid, and it turns out that the liquid does not introduce a significant error in measuring where the bottom surface is." I had to read this a few times to understand what he was saying. The important fact is that, depending on the exact composition of the lakes, including what minor constituents they contain, it is quite possible that Cassini's radio signals can radiate right through the liquid, maybe several meters thick of liquid, reflect off the bottom, and return to Cassini, so some of what we're seeing in the RADAR images is very likely to be the bottom of a lake. And what Randy was saying is essentially that the radio waves shouldn't be refracted, slowed, or otherwise changed so that the computer program misjudges the depth to the bottom of the lake. Very cool.
Randy went on: "So, whether these grayish areas are lake bottom seen through thin (and varying) lake thicknesses or are swampy areas as some have suggested, we should get clues as to their topography. We might even answer the lake vs. swamp question. If the elevation range is too big, it would suggest swamps, because we think we should only see the bottom through a modest depth of liquid. Unfortunately, the measurements to determine how modest that depth is are still evolving.
"The areas south of the island are much darker and it was a real surprise to get elevation points here. When we look at the images carefully and stretch them, we think we see at least a few patterns that are similar in both images and may be real 'bottom' features but it is also possible, even likely, that the computer is just matching the random 'speckles' in one image to those in the other. Thus, one of our next steps is to go back and try to make a map of these areas manually, including only the matches we are confident of. Certainly, the computer matches in this area are very noisy (which is not surprising either way). They also show a higher elevation than the brighter lake/river areas north of the island, which is rather surprising. We'd expect the darkest area to be lowest, i.e., deepest if we are seeing into liquid. So, it's possible that the results in this area are just nonsense.
"To summarize, I believe the general pattern of a lot of the elevations in the brighter lake, estuary, and river areas, but they are definitely noisy. The apparent success of matching in the darkest areas has to be viewed with skepticism but it may be possible to map those areas (or at least parts of them) too. Careful measurements of the most believable features based on the human eye are the way to both edit out some of the noise and establish how far into the darkest parts of the lakes we can really see."
This is just the first of, presumably, many topographic maps, but Cassini's RADAR team will not be able to produce a topographic map of all of Titan, no matter how long the mission lasts. The problem is that in order to make a topographic map this way, you need two overlapping swaths of data. But the RADAR instrument is not even going to be able to image all of Titan once, much less twice. So we'll have these great topographic maps for only some parts of Titan. Hopefully they will be enough to allow Titan geologists to get an intuitive feel for the relationship between geomorphology and topography that they can extend into areas where the topographic data is not available.
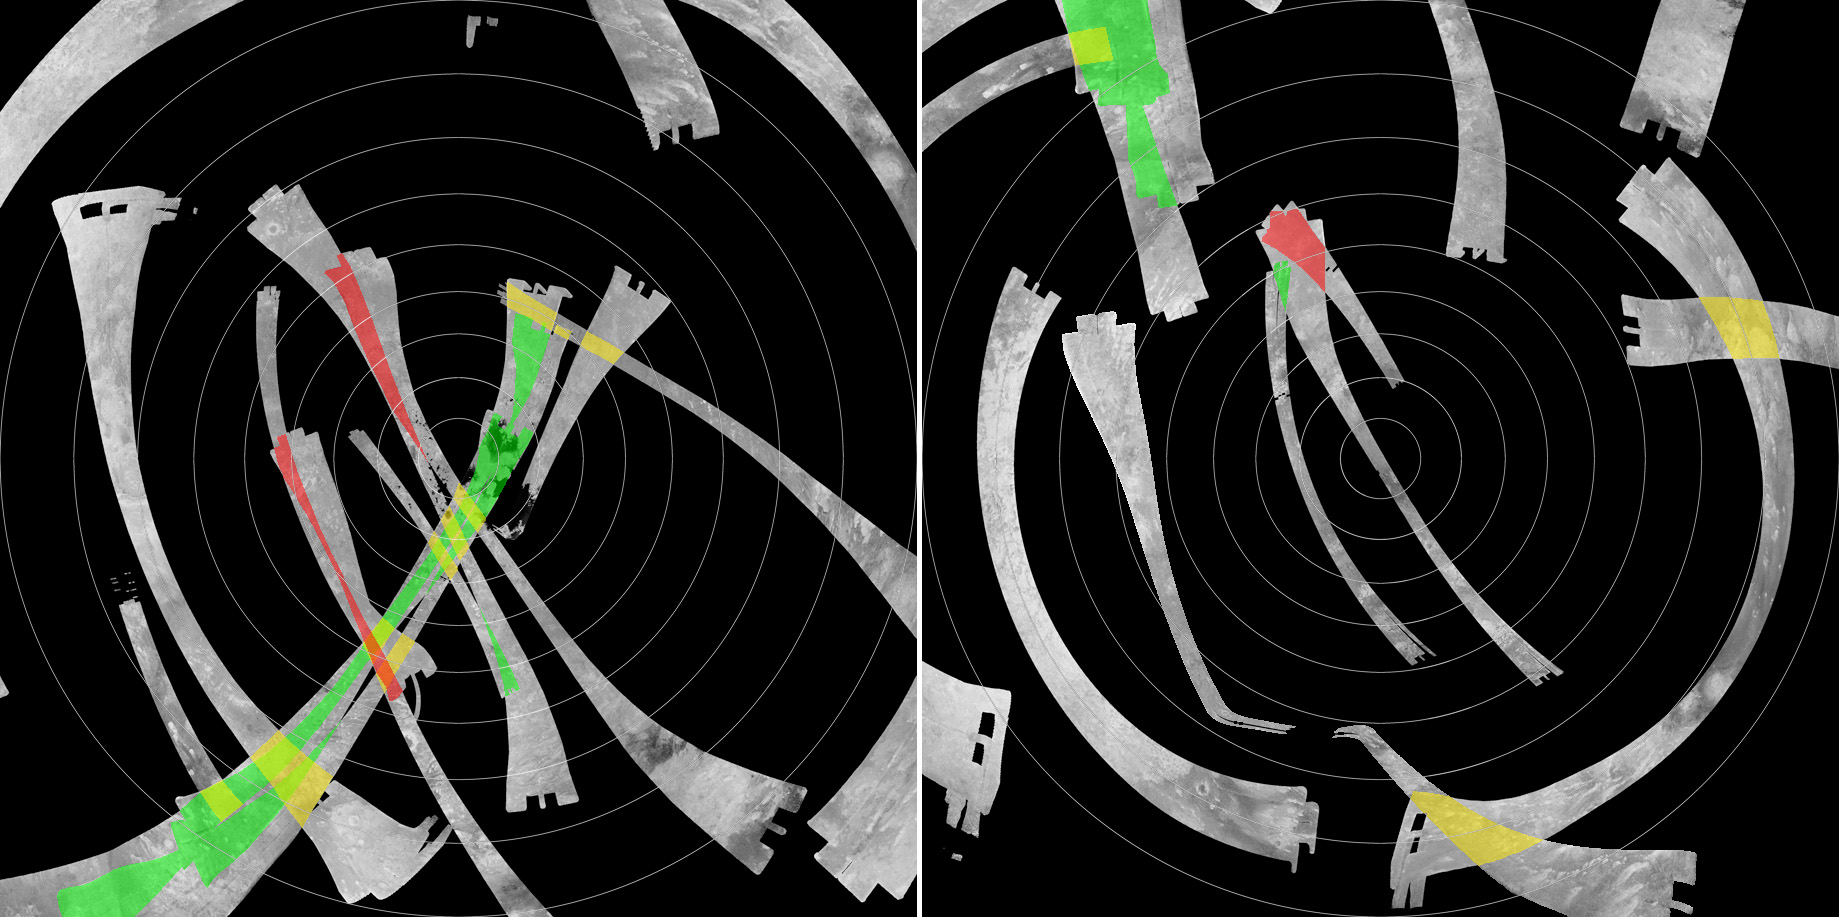
Randy sent me this map, which he presented on a poster at the recent Lunar and Planetary Science Conference, showing all of the SAR swaths acquired to date, and where there are overlaps. The amount of overlap is really pretty small, and here we are near the end of Cassini's primary mission. So these topographic maps will be precious.
NASA / JPL-Caltech / USGS
Overlaps in Cassini SAR swaths on Titan as of March 2008
This map presents two hemispheric views of Titan (from the north, left and from the south, right), including all SAR swaths acquired through the T41 flyby on February 22, 2008. The map is color-coded to indicate how favorable the overlap geometry is for the generation of stereo pairs and topographic maps. Green indicates overlaps where the radar illumination is from the same direction. Red indicates overlaps with opposite-side illumination. Yellow indicates overlaps at nearly right angles.And, of course, there's the small problem that Titan doesn't rotate in quite the same rate and direction as the Cassini team has so far been assuming, a discovery I wrote up last week. Randy said "We're waiting for JPL to reprocess all the images before we work on most of the pairs. Right now,they don't line up properly, precisely because of the error in the old rotation model. Once they are put in map coordinates based on the new rotation model, they should come together much better. The reprocessing should occur in the next month or two and we'll really try to get to work after that.
Protect Our Shared Future
You help us defend humanity and prevent asteroid impacts. Donate now to become a Planetary Defender!
Donate