
 Explore Worlds
 Find Life
 Defend Earth


Happy second birthday to Venus Express
Written by
Emily Lakdawalla
November 12, 2007
Last week, Venus Express passed the two-year mark in space. That spacecraft only took five months to get to Venus orbit, which is just about as fast as you can make it to another planet, which means they've been taking data for more than a year and a half. To celebrate the birthday they released this image, which is composed of about a thousand separate Venus Monitoring Camera observations taken from April to August of this year.
ESA / VMC / MPS / IPF-DLR
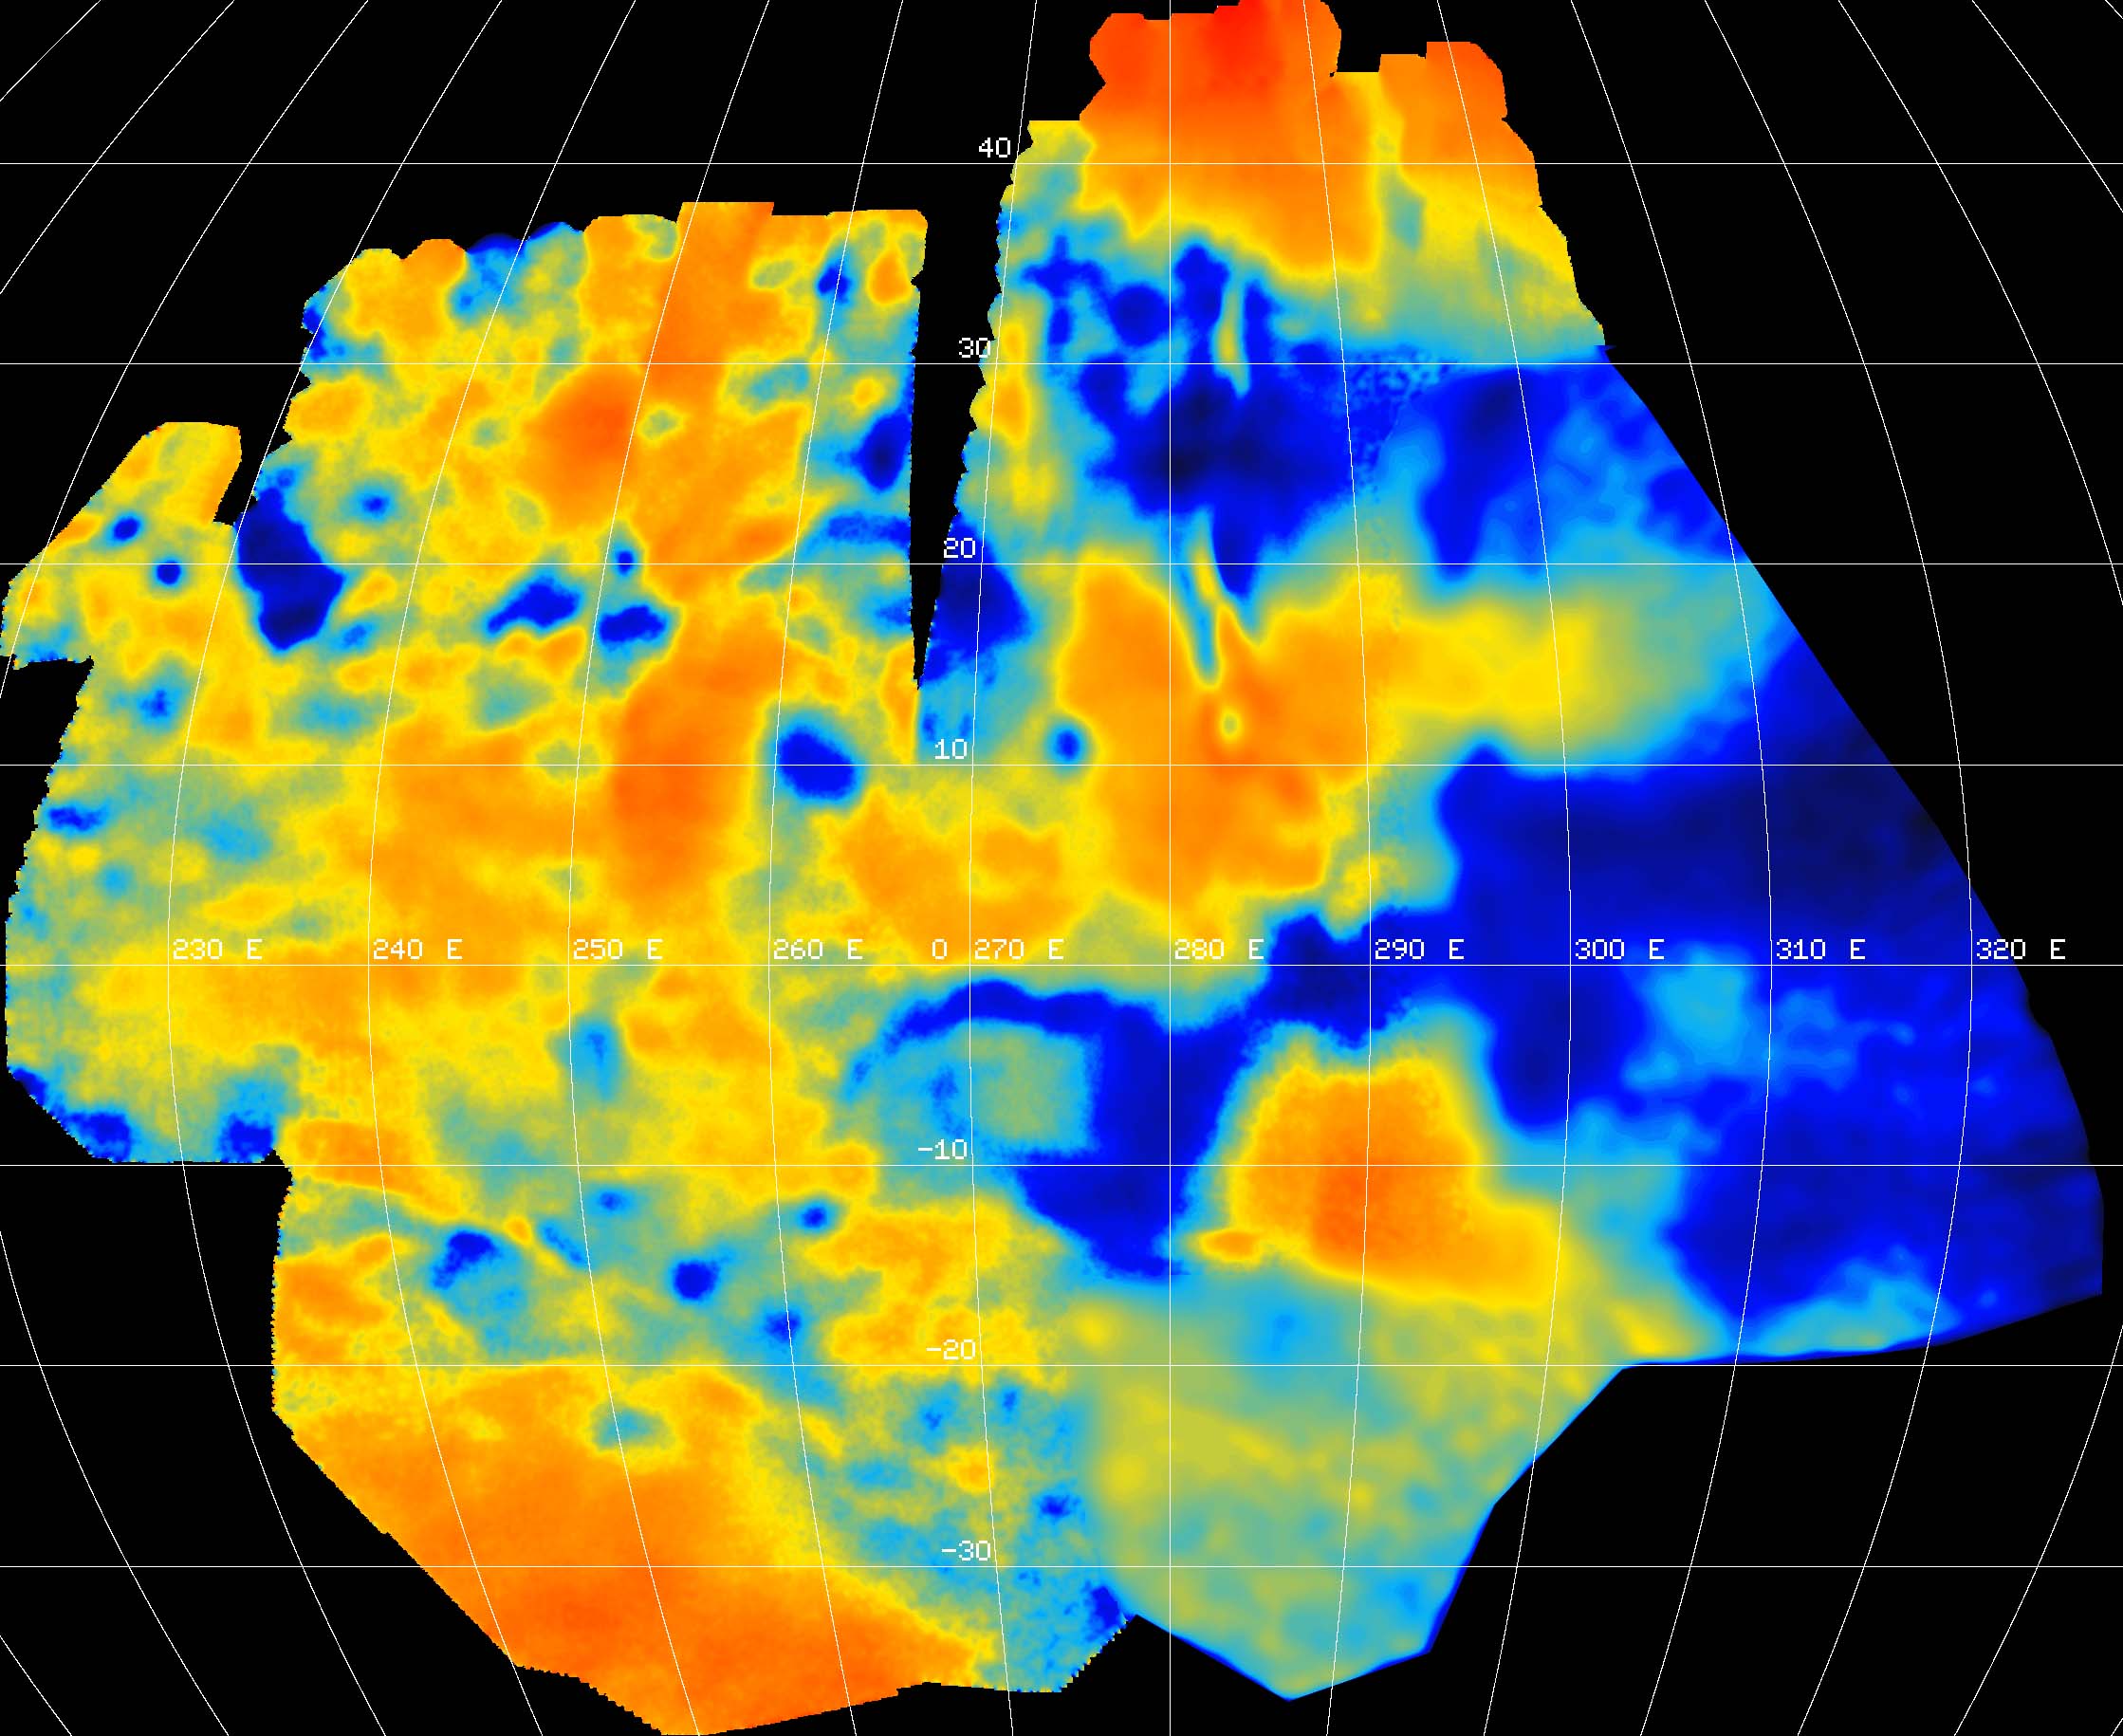
Venus Express image of Venus surface temperatures
This map of the surface of Venus is a composite of about 1,000 individual Venus Monitoring Camera (VMC) images taken from April to August 2007. The images were taken at an infrared wavelength of 1 micron, at which Venus' atmosphere is somewhat transparent. The colors correspond to the apparent temperature of the surface; blue colors are areas about 40 degrees Celsius (70 degrees Fahrenheit) cooler than red-orange colors.Then the Venus Express team has another problem that the Cassini team doesn't face. We can see the surface of Venus in this image because we are looking at it using a particular wavelength of light -- about 1 micron -- in which the atmosphere is somewhat transparent. Unfortunately, Venus' surface is so hot that in addition to reflecting incoming sunlight at this wavelength, it also emits thermal radiation at this wavelength. Titan, by contrast, is much colder, so its surface would emit thermal radiation at much longer wavelengths -- I'm not sure exactly what wavelength, but it's probably between 10 and 20 microns. On Venus, as on Earth, cooler temperatures generally prevail at higher elevations.
Then there's a third effect: surface composition. If all of Venus' surface were composed of pretty much the same rocks, then this image would only show temperature-related effects. But if there is any variation in composition across the surface, then the brightness or darkness of any given spot will be related to its composition in addition to its temperature. In fact, there is compelling evidence from Magellan images of Venus taken in the early 1990s that there are compositional variations, particularly at the highest elevations. Iron-bearing minerals -- found everywhere throughout the solar system, and certain to be an important constituent of Venus' surface -- absorb infrared light at a wavelength of around 1 micron.
Despite all these confounding effects, there is not a bad correlation between temperature in the Venus Express image above and topography in the Magellan image below. The blue areas in the Venus Express image correlate with areas of high, mountainous topography, colored red in the Magellan image, while orange areas in the Venus Express image correlate to Venus' broad volcanic lowlands, colored blue and purple in the Magellan image.
NASA / JPL
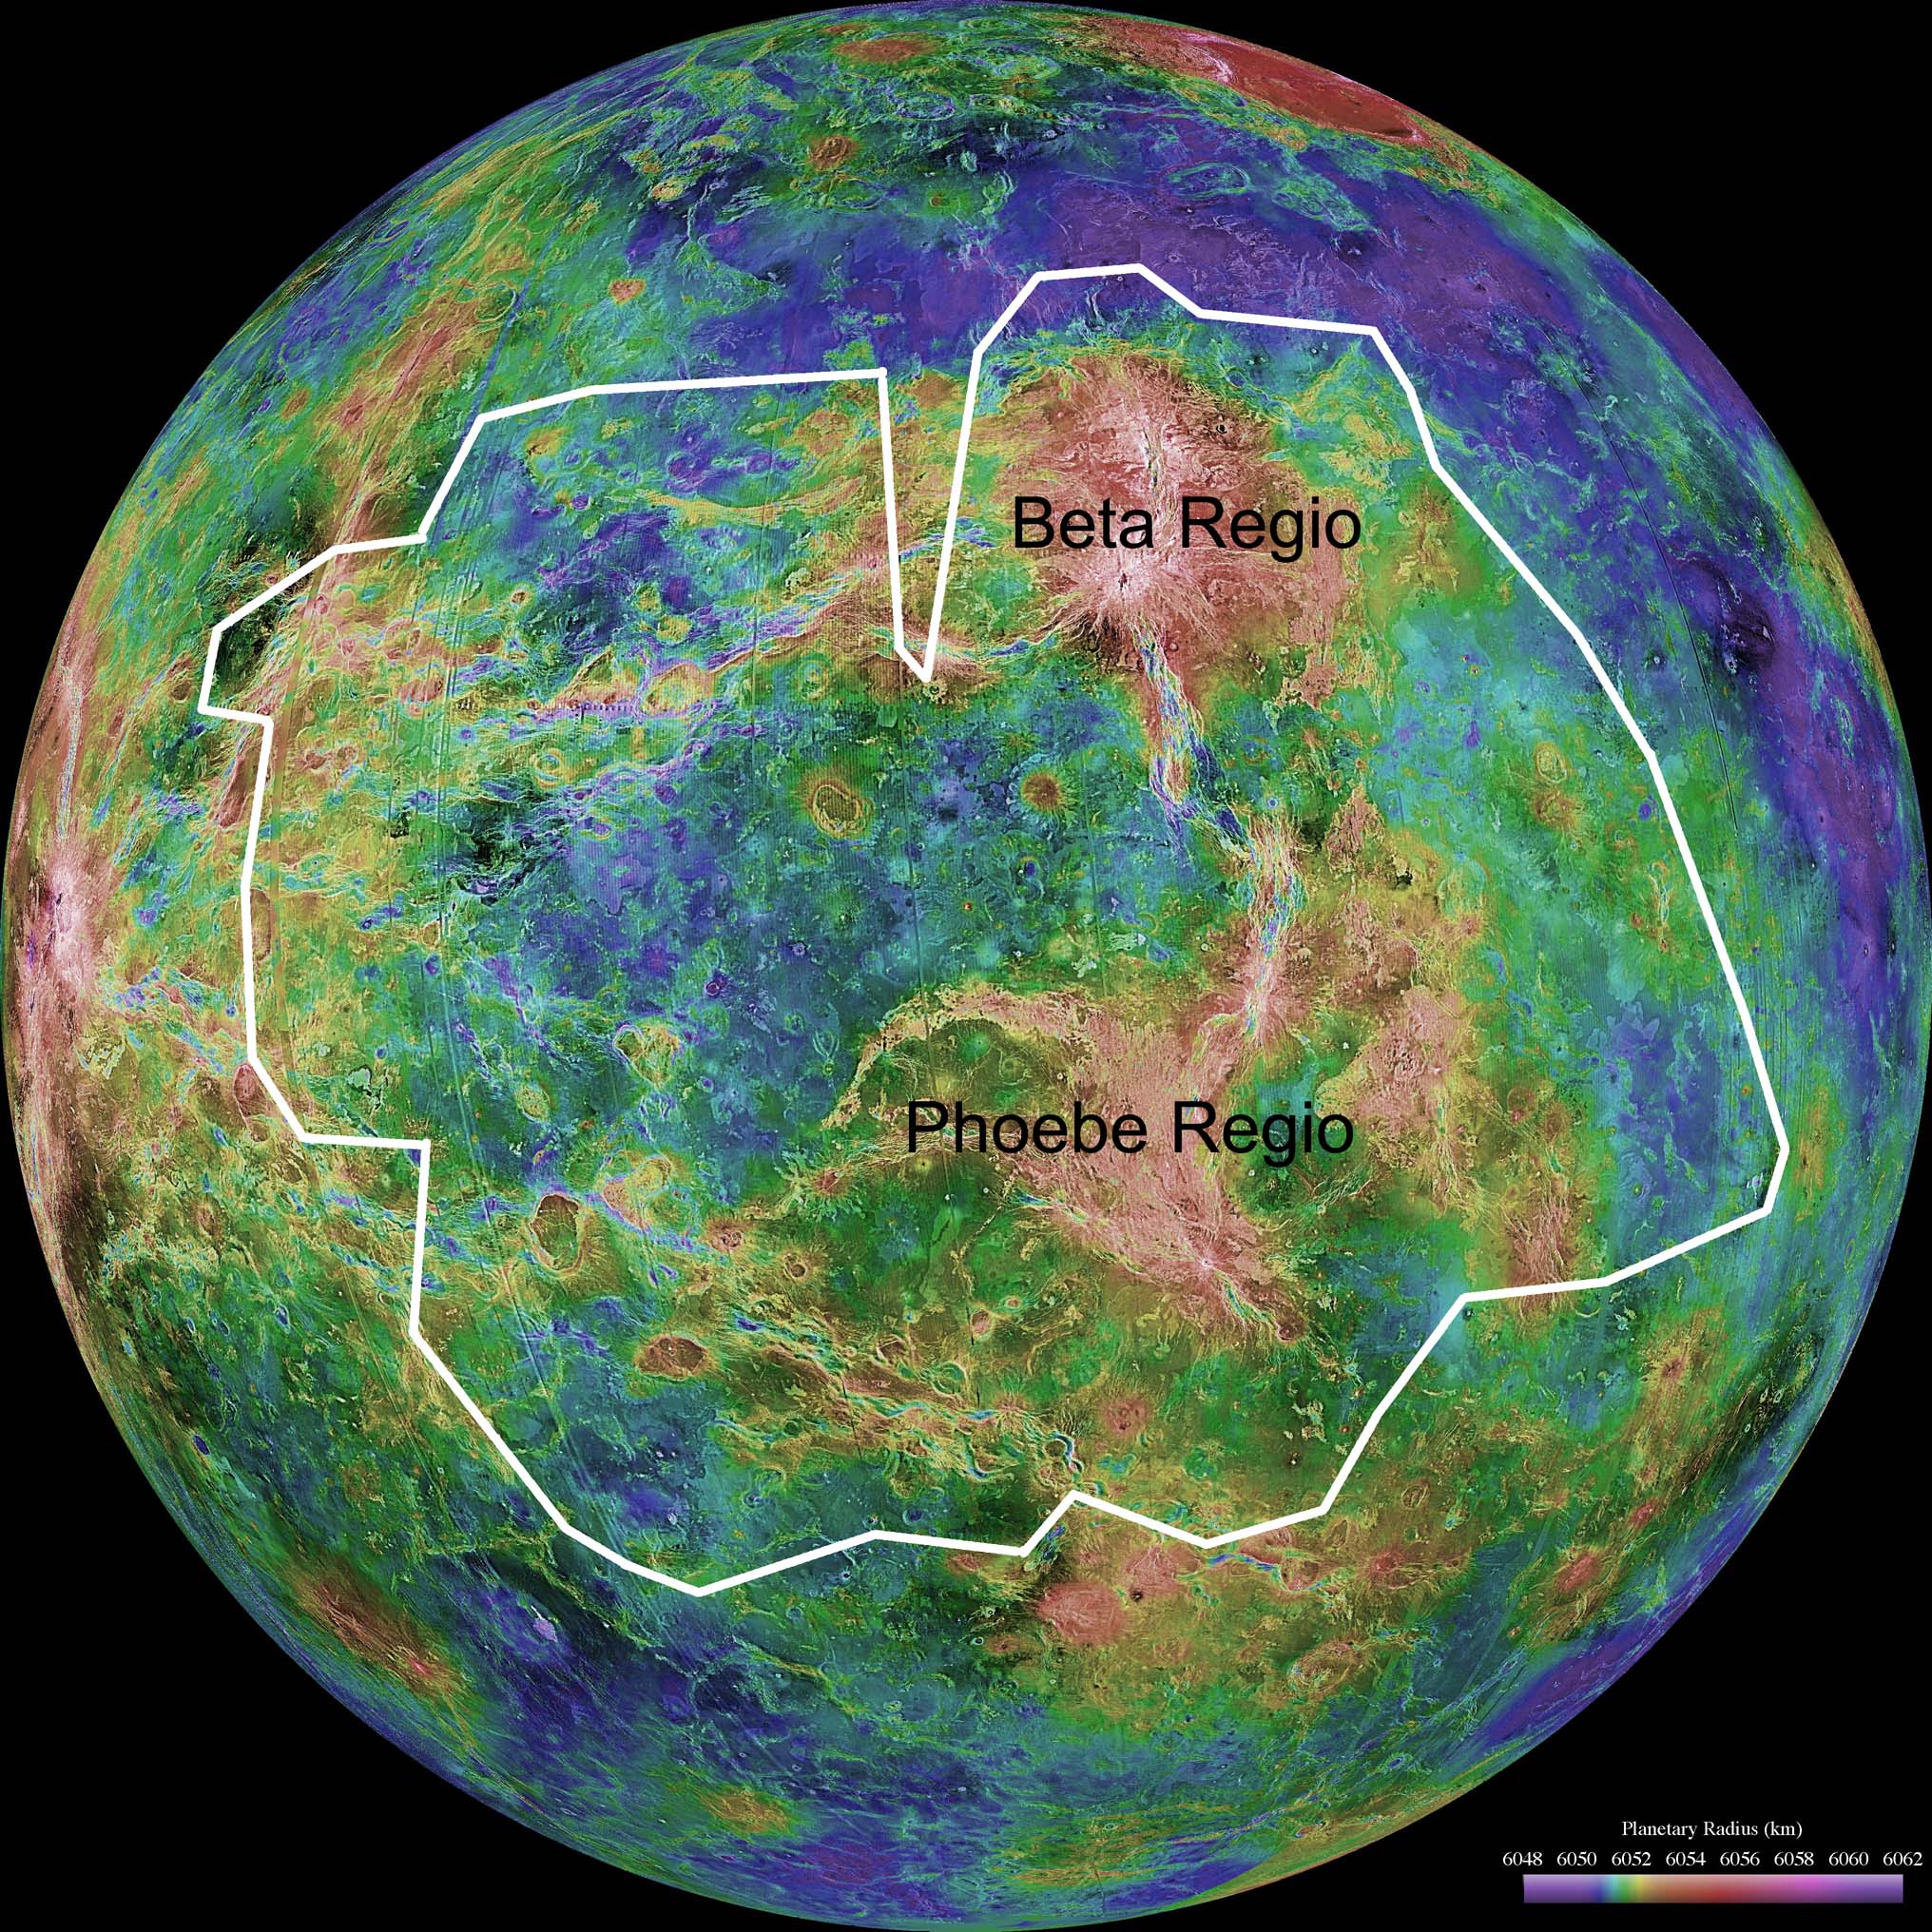
Context map for Venus Express VMC surface image
The white outline shows the location of an image of the Venusian surface captured by Venus Express from April to August of 2007. The base map is composed of Magellan images colored with topographic information; red areas are highest, green intermediate, and blue and purple are lowest in elevation. Small isolated mountains on this map -- showing up as red spots in the middle of blue plains -- correlate well with low-temperature areas on the Venus Express map.Protect Our Shared Future
You help us defend humanity and prevent asteroid impacts. Donate now to become a Planetary Defender!
Donate