
 Explore Worlds
 Find Life
 Defend Earth


Bruce Murray Space Image Library
First simultaneous measurement of sodium and calcium in Mercury’s exosphere
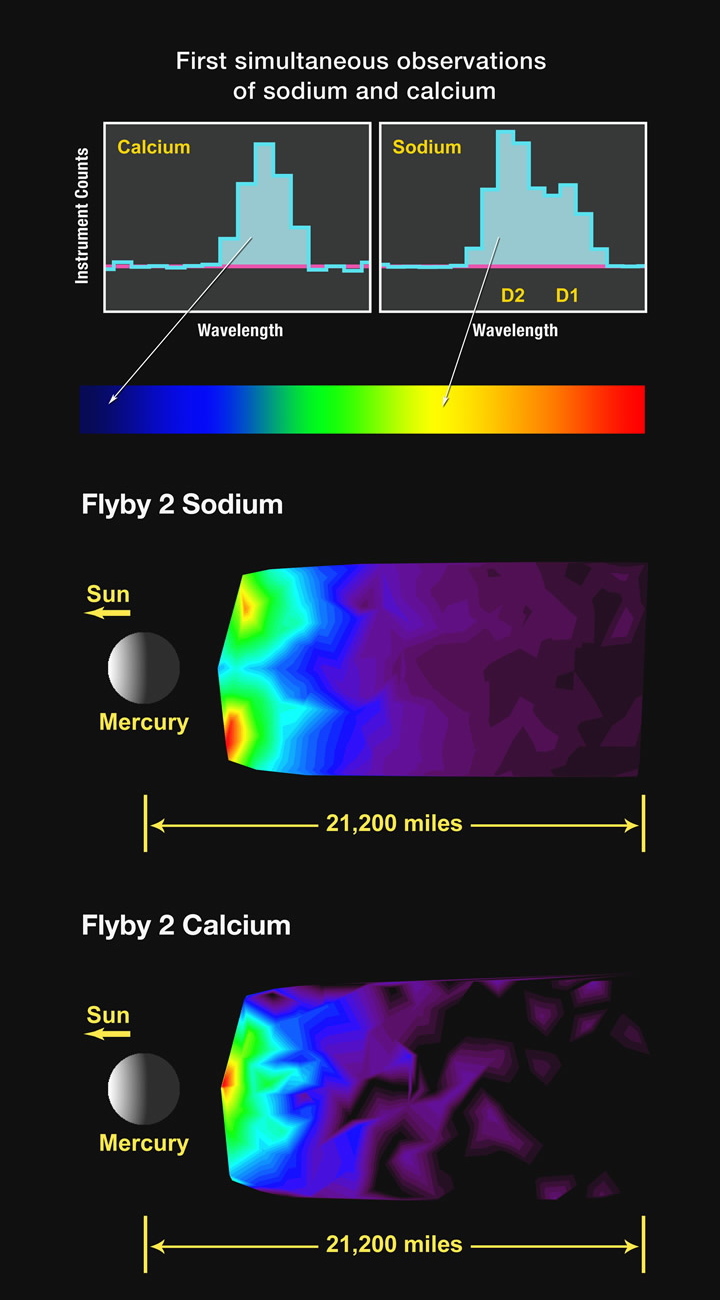
In the upper part of this figure, two histograms represent typical observations in the tail region of Mercury's exosphere from calcium (left) and sodium (right) atoms. Known as "spectral lines," these emissions have been scaled to approximately the same peak level for ease of comparison; however, the sodium emission is much brighter than that of calcium. Each emission occurs at a unique wavelength, with that of sodium in the yellow part of the visible spectrum and that of calcium in the blue part. The sodium emission is actually two very closely spaced emissions that are usually termed the D lines of sodium. The peaks of the two emissions are just separated (indicated by the D2 and D1 labels) in the figure. These are the same emissions that produce the yellow glow in sodium vapor lamps often used in street lighting.
The middle image of this figure shows the spatial distribution of sodium emission, which extends away from the planet in the anti-sunward direction. In the image, north is up and the Sun is to the left. The sodium emission shows two broad peaks that are located close to the planet to the north and south, and there is less emission near the equatorial region. The bottom image shows the spatial distribution of calcium emission. In contrast to the sodium emission, the calcium emission is mostly symmetric about the equatorial region and less bright near polar regions. The spatial variations between the calcium and sodium distributions indicate that the processes controlling these two species are likely different.
NASA / JHUAPL / CIW