
 Explore Worlds
 Find Life
 Defend Earth


David Seal • Jun 03, 2009
Canto II: Titan's Atmosphere and the Solar Cycle
Dante, accompanied by Virgil, descends to the second circle of Hell, where lustful sinners are forever whirled about by a dark and stormy wind. And so we come to Titan.
In my 2006 guest blog "The Winds of Change and Annoyance", I talked about the troubles of planning Titan flybys with limited knowledge of its atmosphere. This is brought about by the conflict between the scientists to go as low as possible, and the capabilities of the spacecraft which must maintain attitude control in the presence of drag. This is a classic mission planning problem. At one point or another we have stressed over possible variations of atmosphere as a function of time, Titan latitude, longitude, solar illumination, whether Titan was inside or outside of Saturn's magnetosphere, the Fates, the Muses, the gods, and - of course - the omnipresent "everything we haven't thought about yet". The gotchas. Well guess what - it's not over.
Understanding the nature and variability of Titan's atmosphere has always been a key scientific goal for Cassini. Titan is the only satellite in the Solar System with an appreciable atmosphere - one of the many features that makes Saturn so target-rich. Adding to this, however, is the need to pin down the facts for the next mission to Saturn. This mission is likely to drop a balloon, lander, or rover into Titan, so it is of critical importance that we gather enough data to support that endeavor. And this is one of the reasons why it is so important that we stick around at Saturn for a few more years, and sample Titan's atmosphere through a full half-season at Saturn. Extending to 2017 would give us 13 years in the system, nearly half of Saturn's 29.5-year cycle. This would include late northern spring and summer, a time period as yet unsampled in-situ.
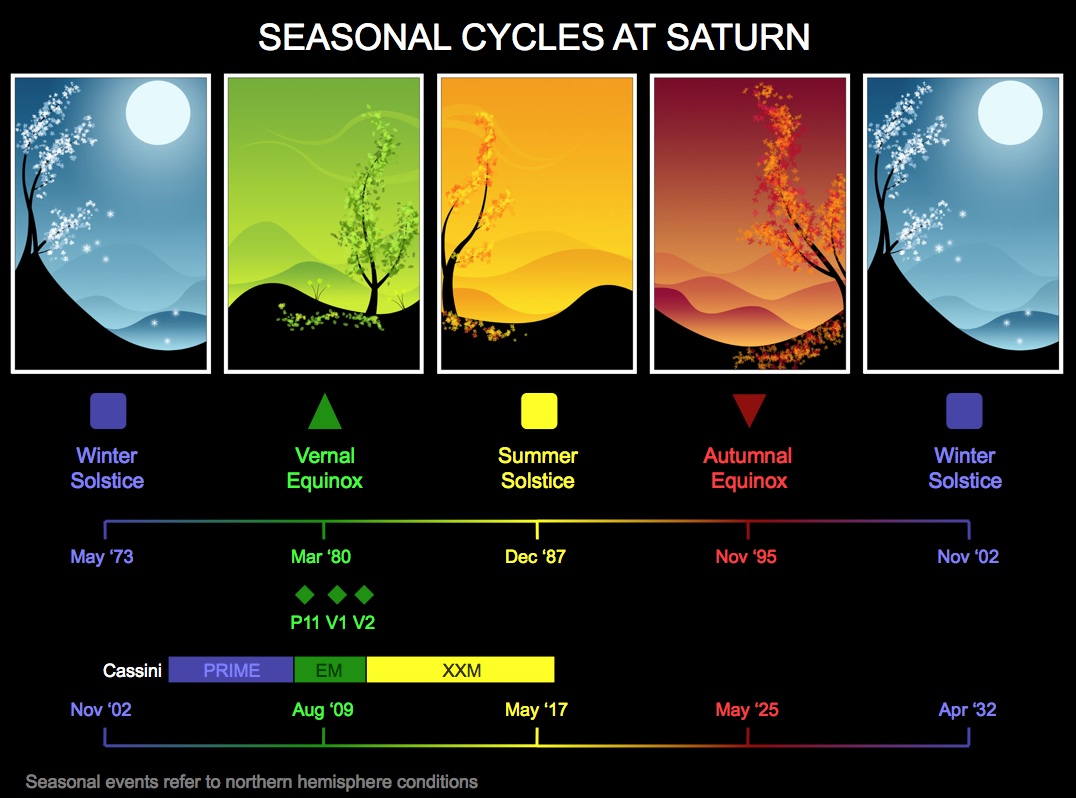
Saturn's Seasonal Cycle
Saturn's seasonal cycle, with Cassini, Pioneer and the Voyagers plotted at their visitation points. Note the relatively narrow range of environment sampled pre-Cassini and that Cassini's second mission extension will be breaking new ground.
Once we got past the first few data points, as I discussed in the first Titan blog, Titan's atmospheric variations seemed to hover around an average nicely in line with our predictions. There were small expected deviations from the mean from flyby to flyby, attributable to minor effects from a variety of possible sources (such as those mentioned above). Even possibly just variable geometry of the sampling instruments - namely the Ion and Neutral Mass Spectrometer or... the spacecraft. We do, after all, measure the effects of the atmosphere with the engineering subsystems (e.g. duty cycle of thruster firings), and therefore the atmospheric mass density itself.
So for a while it seemed like Titan's atmosphere was constant, with reasonable small variations on the order of a few percent flyby-to-flyby. But now we're not so sure. And that's because of the Solar cycle.
As you probably know, the Solar magnetic activity varies on a roughly 11-year cycle. This modulates everything from Sun's atmosphere and corona to short-wave radiation to the occurrence of flares and sunspots. The Solar cycle has an appreciable effect on Earth's atmosphere; one of the many responses is on the Space Shuttle flight dynamics officers, who must use the estimated solar flux to accurately predict the atmospheric drag on the Shuttle, and therefore its orbit. Similar effects could easily take place in Titan's upper atmosphere, where we fly, even though Titan is roughly ten times as far from the Sun as the Earth (and therefore receives about one one-hundredth of the Solar radiation). We just don't know for sure.
This situation has been compounded by the fact that we have been at Saturn during Solar minimum - a LONG solar minimum, the duration of which has defied prediction by the best Solar scientists on the planet. Back in 2007 a "sharply divided" panel predicted the solar minimum would come in March 2008 - didn't happen. The solar activity is still pretty flat over one year later. Currently Dean Pesnell of the Goddard Space Flight Center, NASA's lead representative on the prediction panel, predicts a peak in May 2013. "Go ahead and mark your calendar for May 2013. But use a pencil." That's weather prediction.
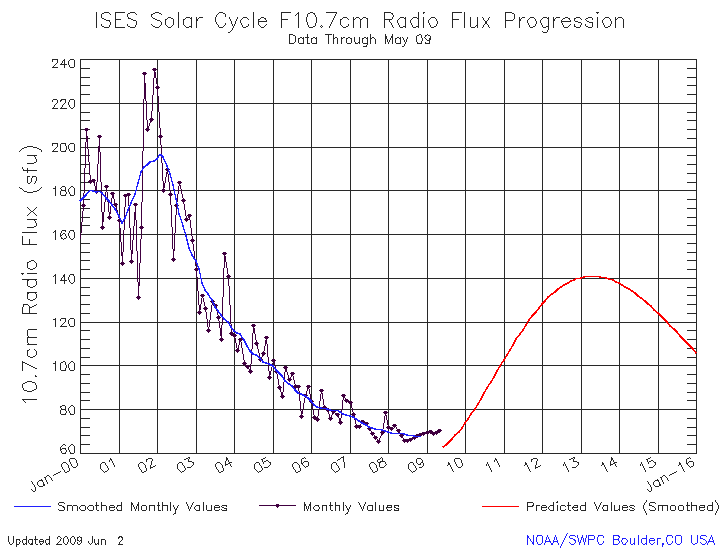
Solar Cycle
Solar cycle plot through May 2009. Full article at http://science.nasa.gov/headlines/y2009/29may_noaaprediction.htm
So as you can see from the Solar cycle plot, we just haven't seen a lot of Solar activity, so it's hard to pin down what effect an upcoming Solar maximum will have on Titan's atmosphere. (Look at years 2005-2009; we arrived in 2004 but didn't have many close flybys until mid-2005.) All we can do is look at what data we have - a few dozen flybys during a small arc of solar variability. So let's do that. Our first Titan plot (latitude) was one of the earliest plots we monitored, and shows atmospheric density flyby-to-flyby normalized to 1000 km, near our typical minimum altitude above the surface. Does it look like there's a trend there? Possibly. Looks like the northern latitudes are denser, and the southern latitudes are less dense. But there's a lot of scatter there; it's not quite enough to convince me completely. And guess what - there's another trend at work here.
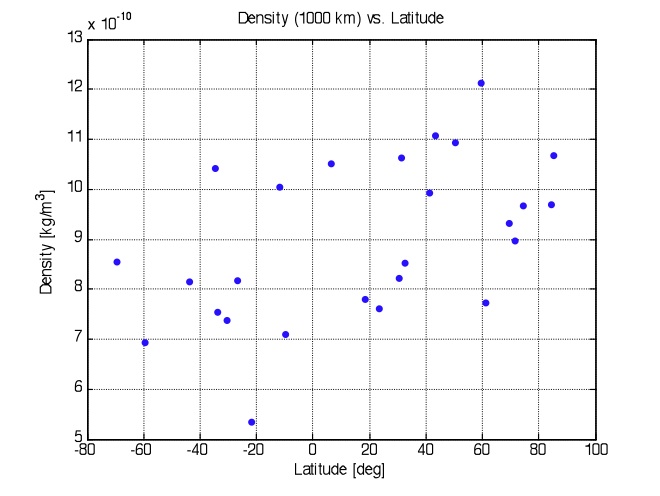
Titan Atmospheric Density
Titan flyby atmospheric density (normalized to 1000 km) plotted with respect to latitude. Each blue dot is a separate flyby.
Let's look at the second Titan plot (latitude w.r.t. time). Most of the early mission flybys are in the northern hemisphere, when the Solar activity was higher! The later flybys are in the southern hemisphere. So what have we got? (See the last Titan plot.) A latitude variation independent of time? Possibly. A Solar cycle variation independent of latitude? Perhaps. A scatter plot with no clear trend yet? Maybe. A combination of two or all three? Could be. Welcome to mission planning once again: the art of making the best decision with incomplete information.

Titan Flyby at Closest Approach
Titan flyby latitude at closest approach plotted with respect to time. Note how most of the northern hemisphere flybys are early in the tour, and the southern ones are later in the tour.
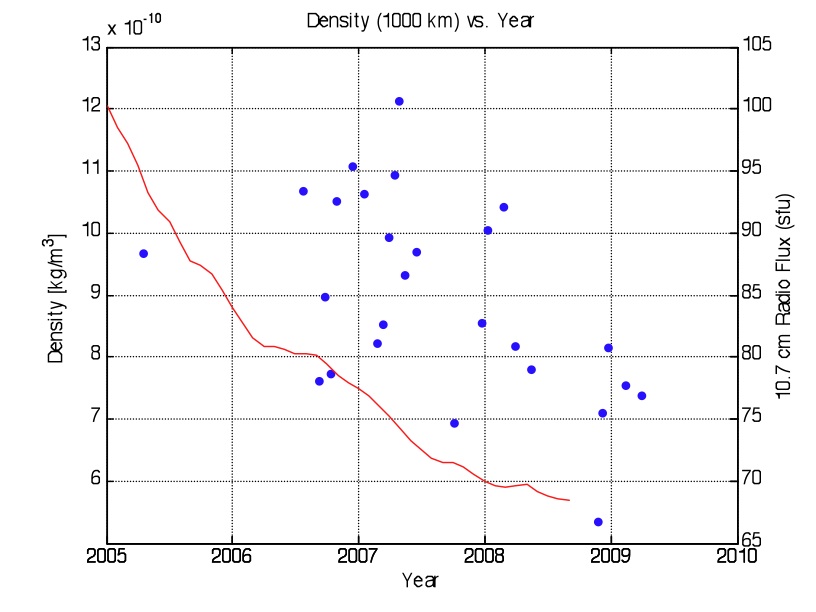
Atmospheric Density Plotted with Time
Titan flyby atmospheric density (normalized to 1000 km) plotted with respect to time, with observed Solar flux (red line). Trend?
This experience is a lot like playing poker (which I've acquired a small amount of skill at). You don't get to see all the cards, but you get hints over time as to what is going on. If one of your opponents raises six times in a row, chances are that if you have a good hand on the seventh you've got him beat. Unless luck, i.e. statistics, handed him good hands all seven times. You study all the clues you can get your hands on and weigh everything together. The best poker players are the ones who gather the most information and apply careful and correct thinking to make the best decision. That's our job here - to remove luck from the equation as much as possible. However, to take a lesson here, event the best poker players lose a lot.
One of the tools engineers and scientists use to determine whether there is a linear relationship between two variables - in our case, Solar flux and Titan's atmosphere - is covariance, or more specifically, correlation coefficients. This indicates the strength of the relationship, or in more dense statistical parlance, the departure of the two variables from complete independence. The higher the correlation coefficient (i.e. closer to 1.0 from 0.0), the more likely that they are tied together via some concrete phenomenon. (Like raising with deuce-seven, and losing money, in Texas Hold 'Em.) It turns out that the correlation of Solar flux and Titan's altitude runs at about 0.3-0.4, depending on exactly how you do the math. This is considered "medium" correlation - of course. In other words, it's just not clear.
What happens if they really are correlated? Well, as you can see from the Solar activity plot, the Sun is going to get a whole lot more active than it's ever been while we've been at Saturn. This could mean that our minimum altitudes may have to go up - a lot. If the radio flux goes from 90 to 140, that could mean an extra 50-100 km higher altitudes. That's enough to require minor trajectory redesign (which we may not be funded to do, easily) or more thruster capability to keep the spacecraft taking data and under control (which we don't have). On the other hand, if there isn't a correlation, and we raise the altitudes and are wrong, then we're higher than we should be and the science suffers. Here I am in the dark woods again.
Our saving graces - perhaps - come from two sources. First, Voyager 1 made Solar occultation measurements of Titan's atmosphere, and this flyby occurred not only near the Solar maximum (a Solar flux of 213!!), but when Saturn was closer to the Sun (its orbit is somewhat eccentric). Strangely, the mass density derived from these measurements are actually lower than the mass densities measured by the Huygens Probe in 2005. So this may be a key piece of evidence suggesting that the Solar cycle has little effect on Titan. The second argument is more or less scientific common sense. To extrapolate terrestrial experience to Titan (1/100th the Solar irradiance) just doesn't make a lot of sense. The energy balance in Titan's upper atmosphere is more complex than on Earth. Radiative cooling is more important, and energy loss from atmospheric escape may also play a dominant role. As Titan continues to recede from the Sun (with Saturn), the atmosphere may cool and this may be a more dominant factor.
Therefore, we have chosen not to incorporate Solar effects while planning our second extended mission, but to monitor closely Titan's atmosphere on every flyby. If we see something unexpected happening - if our poor soul is punished by the sweep of the black wind - then there are a number of things we can do to respond, some benign to science, some not, depending on how able our team is to replan. Is this strategy wise? You tell me - what would you decide? Stay tuned - we'll all find out together by 2013. (Maybe.)
In closing, I should credit Gene Lee here at JPL, Roger Yelle of LPL at Arizona, and Darrell Strobel at Johns Hopkins who performed the bulk of the real analysis over the last several months.
Let’s Go Beyond The Horizon
Every success in space exploration is the result of the community of space enthusiasts, like you, who believe it is important. You can help usher in the next great era of space exploration with your gift today.
Donate Today