
 Explore Worlds
 Find Life
 Defend Earth


Emily Lakdawalla • Aug 17, 2007
Ices, Oceans, and Fire: Tuesday afternoon: Landscapes
I need to move along here and try to wrap up my coverage of the workshop on icy satellites; I still have a day's worth of notes left! Here goes, an attempt to breeze through Tuesday afternoon's session on the geomorphology of stuff in the outer solar system...as before, links from talk titles go to abstracts in PDF format.
The session was opened by Jeff Moore giving a survey of "Erosion and Regolith on Outer Solar System Satellites." Although intended as an overview, his talk quickly focused on Callisto as one of the weirder erosional environments in the solar system. For instance, he pointed out landslides all over the outer solar system, even on some of the very oldest surfaces, like Callisto and Iapetus.
NASA / JPL / Jeff Moore
Debris slides on Callisto
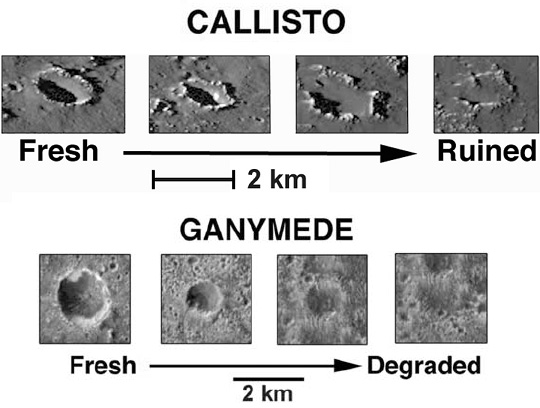
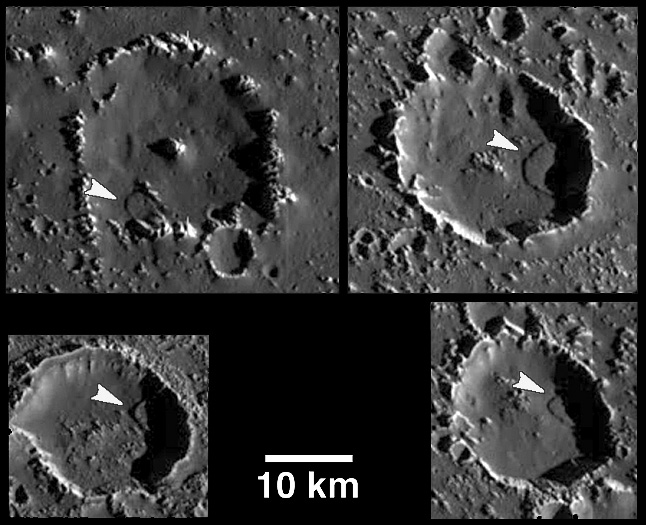
NASA / JPL / Jeff Moore
Crater degredation on Callisto and Ganymede
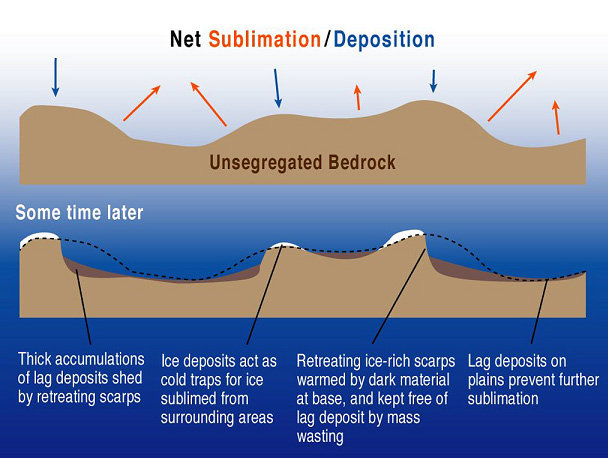
Jeff Moore
A model for the degradation of Callisto's topography
In this model, Callisto starts out with a surface roughened by impacts. Volatile materials -- water ice and, probably, carbon dioxide ice -- sublime from this surface and then get redeposited. Physical models suggest that the floors of these craters will experience net sublimation, while the peaks will experience net deposition of frost, a process that accelerates as the floor accumulates a lag deposit of dark materials (which absorb more solar radiation and thus get warmer) and the peaks accumulate a deposit of bright, reflective frost. Bedrock is only exposed in the steepest part of the crater walls.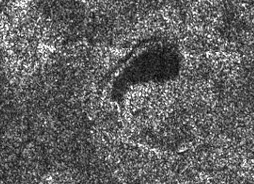
NASA / JPL
A possible caldera on Titan
This dark feature, one of many possible lakes near the north pole of Titan, is partially encircled by a cliff. Radar illumination is from the north; north-facing slopes are bright, south-facing slopes are dark. The morphology looks much like volcanic calderas, where multiple episodes of volcanic eruption and collapse can yield nested, kidney-shaped crater features.The smaller, rounder ones, Karl said, "look fairly convincingly like collapsed, nested calderas. But when you look at the landscape as a whole, and see how many lakes there are, it's difficult to justify" the statement that all of them are calderas. "So we've been thinking more in terms of karst recently. Karst forms where you get extensive dissolution of an extensive soluble substrate. In this case, the liquid causes the landforms, rather than just filling available depressions. The chemistry can only be speculated, but see Jeff Kargel's goos. There is a scaling problem in that many of these lakes are much larger than [equivalent landforms] on Earth, but then there's probably more time for them to form." Karl also pointed out that Titan is a big place, and it's naïve to assume that all of Titan's lakes formed by one and only one process. He also said that while "there is no absolute proof that these are liquids, every test we can throw at them is consistent with them being liquids." Coinciding with the meeting, the RADAR team released another swath of data showing lakes, which I must add to the Titan RADAR page soon...
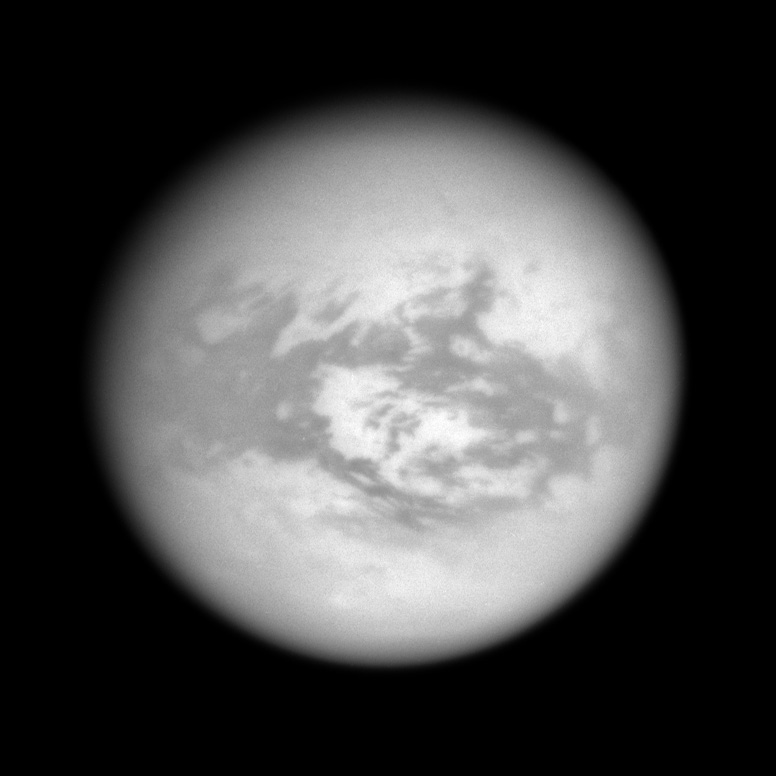
Next, Zibi Turtle gave a talk for Jason Perry on "Cassini ISS Observations of Titan's Trailing Hemisphere." Over the last six months, Cassini has been getting excellent views of the trailing and anti-Saturn hemispheres of Titan (earlier in the mission, Cassini's sunlit view was of the leading hemisphere). The trailing hemisphere includes the bright region known as Adiri, off the east coast of which was where Huygens landed. She showed a really lovely high-resolution mosaic of Adiri and points north, which hasn't been released to the public yet either, but here's a lower-resolution view:
NASA / JPL / SSI
Titan's anti-Saturn hemisphere
Titan's equatorial regions are covered with dark-toned deposits of sand dunes. This image, of the anti-Saturn side of Titan, was captured by Cassini on June 14, 2007. The bright region at the center is called Adiri; the Huygens probe landed off of the northeastern edge of this bright region. The image has been rotated so that north is up. The trailing hemisphere is to the left; the leading hemisphere is to the right.Bill Johnson gave a talk on "Cassini RADAR Altimeter Observations of Titan." His talk included an explanation, which I hadn't appreciated before, of why altimetric observations have been so difficult for Cassini. It's just that the geometry of the flybys is really pretty much totally wrong for an altimeter. An altimeter would like to be flying at pretty much a constant altitude over a body, so that the change in delay time along-track has only to do with local topography. But when Cassini is close to Titan, its RADAR instrument is usually performing SAR imaging; altimetric data is only collected between about 18 and 30 minutes before and after closest approach. As a result, when Cassini is collecting altimetric data, "we are moving toward the surface at two meters per millisecond. You don't want to do this with altimetry," Johnson said. They have actually done one flyby, T30, where "we sacrificed about half of our SAR swath to do altimetry." He showed that altimetric profile, and there was, indeed, lots of interesting structure. The T30 altimetric profile turns out to have tracked right down the middle of the SAR swath acquired just two flybys previously, on the T28 pass. Since nothing having to do with Titan is allowed to be easy, correlating the SAR imagery with the altimetric profile is proving to be challenging. So, Johnson's first conclusion from the altimetric studies was a rather conservative one: "Titan is not a smooth sphere." This elicited a chuckle from the audience.
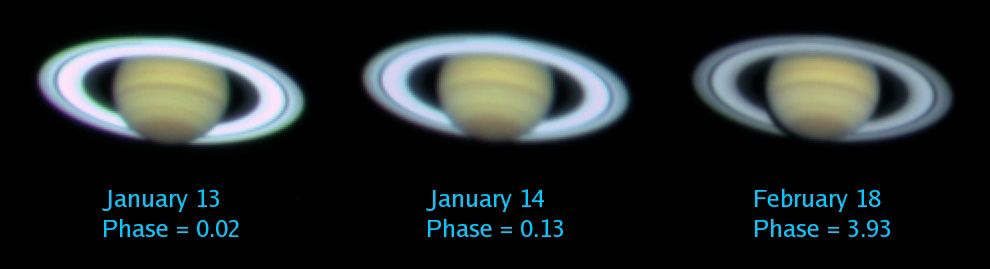
After the coffee break (which was when I acquired what proved to be too much caffeine), Bonnie Buratti gave a really interesting talk on "Opposition surges on icy and rocky moons." Bonnie defined what "opposition surge" means: "As a moon becomes full, it becomes brighter than what you would expect by extrapolating from other phases." You see opposition surges by looking at a graph of how bright a surface is with respect to the phase angle at which it is illuminated. I don't have such a graph handy but I do have some nice images showing opposition surge effects seen from Earth in Saturn's rings.
Anne Verbiscer
Opposition surge of Saturn's rings
Three views of Saturn captured on different dates with the 2.2-meter telescope at the Calar Alto Observatory in Spain. Phase angles are measured in degrees. On January 13, Earth crossed the disk of the Sun as seen from Saturn, so Earth-based telescopes saw Saturn and its rings and moons with a "phase angle" (Sun-target-observer angle) of zero degrees. The globe of Saturn does not change much in the three views, but the rings flash into brilliance as the phase angle goes to zero. This effect is called "opposition surge" and was also seen on some of Saturn's moons, especially Enceladus.Among surfaces in the outer solar system, Triton has very little opposition surge, indicating a compact (not fluffy) surface. Titania and Oberon have huge surges. Clementine also saw a decent-sized opposition surge at the Moon (an effect you can't see from Earth because at opposition you have a lunar eclipse!) Cassini has seen nice opposition surges on rings, and obviously, so have Earth-based telescopes.
"Practically everything in the solar system seems to have a standard 'fluffy' opposition surge of varying magnitude," Bonnie said. "Enceladus is particularly fluffy. There are only a couple exceptions, Triton and [asteroid] 1175 Anchises. Most objects also have 'spiky' surges, within 0.2 degrees. Triton does. Umbriel does not." However, not many objects have been observed at the tiny phase angles necessary to see "spiky" surges, Bonnie said. "There are only a few hours where they're at these small phase angles; the small angles are almost never seen for Kuiper belt objects."
Recently, there were some observations of Iapetus with phase angles down to 0.03 degrees. Bonnie is on Cassini's VIMS team, and using VIMS data, she reported that she saw the spiky surge there; however, the observations were from too far away to discern whether both the bright and dark terrains on Iapetus produced the spiky surge, or if only one of them did; Iapetus was less than one pixel to VIMS. ISS has higher resolution though; Bonnie was asked whether ISS data has revealed whether the spiky surge is seen in both terrains, but she said that since the ISS data has not been released to the public via the Planetary Data System yet, she was not at liberty to say.
Next, Tilmann Denk gave a talk on "The Surface of Iapetus." This was, in large part, a preview of what we might expect from the close flyby, now only three weeks away. Tilmann showed some lovely high-resolution images comparing the textures of the dark and light terrains. "There are craters everywhere. Dark terrain exhibits the same amount of craters as bright terrain. In case you are interested in the 335-year-old-question how the dark-bright dichotomy has been formed, then you must also explain how there are the same number of craters in dark and light terrain."
It was difficult to tell topography from albedo changes on the contrasty surface of Iapetus from Voyager data, but Cassini has revealed much more topography. "On Iapetus you have four large basins, and probably even more." The four definite basins have diameters of 365, 571, 490, and 421 kilometers. Tilmann showed an image of a digital elevation model of Iapetus that has revealed an even larger depression in the topography 714 kilometers in diameter. (This is fully half of Iapetus' 1,460-kilometer diameter.)
NASA / JPL / Space Science Institute
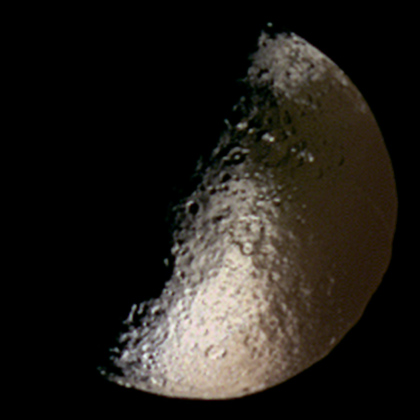
Iapetus in false color
This view was produced from three captured through ultraviolet, green, and infrared filters on October 15, 2004. An intriguing line of white peaks sticks up above the brownish dark terrain, part of Iapetus' "belly band." The full resolution image has been enlarged by a factor of two to show detail. The leading side of Iapetus is on the right, with the trailing side mostly in the dark. The redder color of the bright terrain on Iapetus' leading side is clearly visible.And a third mystery: "Interestingly, there are no bright holes into the dark terrain." Nothing bigger than 1 km, anyway; there are no places where impacts have punched through the dark stuff to reveal bright stuff. "If you want to explain how the bright-dark dichotomy formed, you have to explain why there are no bright-rayed craters in dark terrain. RADAR data suggests it is no more than decimeters thick." (During the question-and-answer period, John Spencer pointed out that he has proposed what seems to be a workable model, one that I covered when he talked about it at DPS a couple years ago.)
Tilmann also pointed out that Cassini data reveals color variations across Titan. Within the dark material, if you do a ratio of ultraviolet and green images, these color variations "pop out." There is also a color dichotomy independent of the bright-dark dichotomy between the leading side and trailing side, such that the leading side, both where it is bright and where it is dark, is redder than the trailing side. Tilmann finished his talk by showing an animation of where the Cassini ISS frames will fall on Iapetus during the upcoming flyby, an animation that I wish I had to show you! But I don't.
There's just one more talk from this session that I listened to before bugging out, but as my daughter is waking up from her nap I'll have to save that for another day!
Let’s Go Beyond The Horizon
Every success in space exploration is the result of the community of space enthusiasts, like you, who believe it is important. You can help usher in the next great era of space exploration with your gift today.
Donate Today